December Demand Index
We’re excited to update the SaaS Demand Index with data through December 2023.
For our new readers: the Demand Index is derived from high-intent (aka “okta pricing”) Google Search volume data.
Reminder: this is a directional, free, and ever-evolving* analysis → always do your own due diligence.
Moreover, the data captured here is best characterized as top-of-funnel or dark funnel → factoring in sales cycle length, do NOT use this Demand Index as a predictor of near-term financial results and/or financial guidance.
Industry-Wide Data
High-intent search volumes were up +1% year-over-year. Relative to expected industry growth rates for SaaS (Gartner at +19% industry-wide for 2024), these trends are disappointing.
On a sequential basis versus November, the Demand Index declined -13%. Caveat: seasonal factors are very strong in December, so I would not evaluate *this* month’s results on a month-over-month basis.
Trends By Product Category
Zooming out to recap almost three years of data on our cumulative growth since January 2021 slide:
This slide presents growth for the last month and last three months, respectively:
Callouts from the December and last 3 months’ data:
Data + Analytics: A surprisingly weak Q4 2023 vs CIO survey commentary on investments in data tools to better enable coming AI investments.
Development + IT Management: While generally weak, Observability had a notable fall off in Nov/Dec while Robotic Process Automation (RPA) has been stable.
Above Average Performers: Communications, Finance + ERP, HR + HCM, Industry Specific / Vertical, and Security
All of the category drill-downs - like these Data + Analytics and Development + IT Management examples - are available in this slide PDF:
2024 Takeaways From Maxio + Benchmarkit Report
A few quick highlights from Maxio's "2024 Growth Index Report" and accompanying webinar with Ray Rike / Benchmarkit:
Consumption Outperforms Subscription
Consumption models have been perceived as at risk in a weaker demand environment, so the 2023 outperformance is notable:
2024 Forecasts: Too Optimistic?
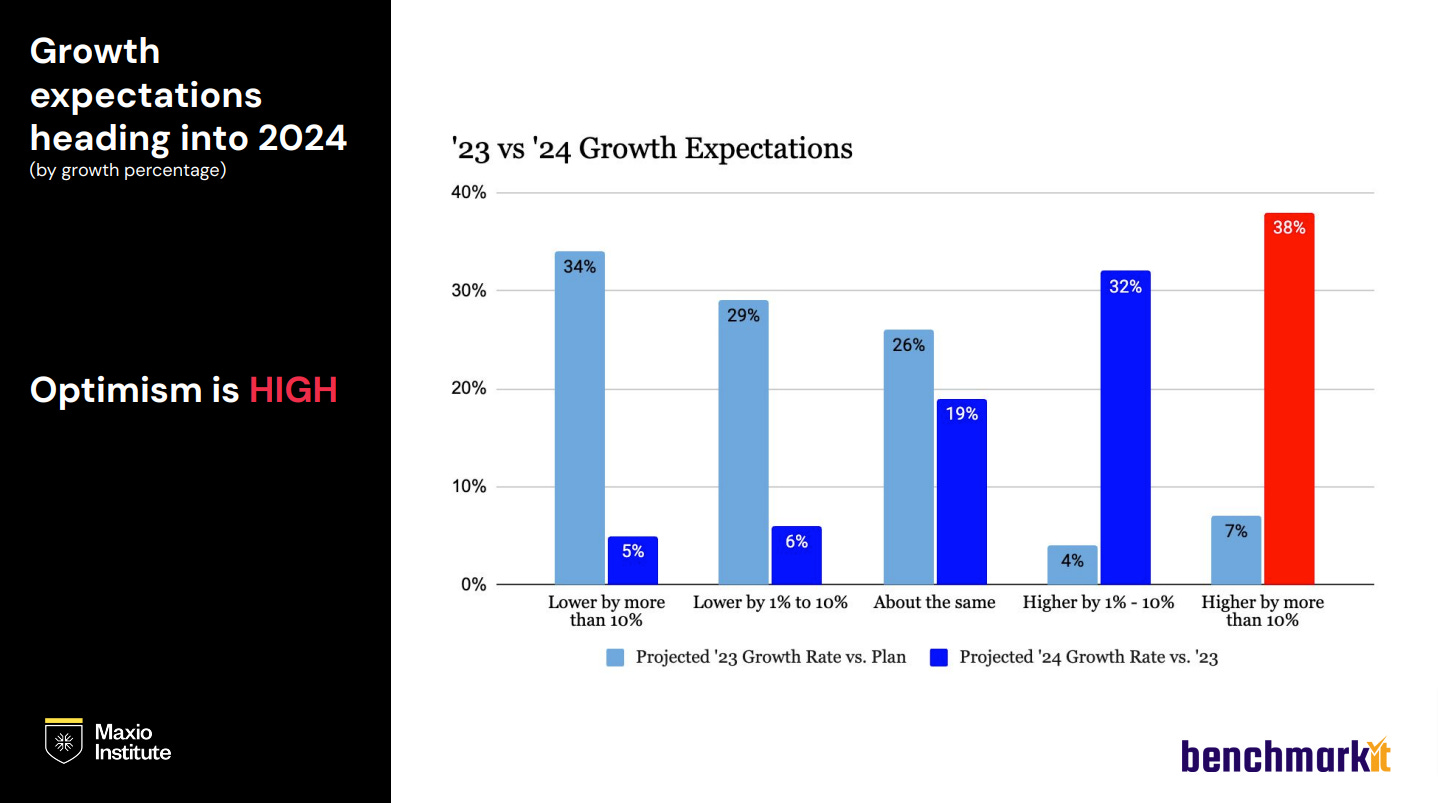
63% of companies missed plan (see left bars)...
but 70% are forecasting accelerating growth (see right bars)
By contrast, our analysis of Pavilion executive member forecasts, showed less acceleration, even -3% declining growth for the $30m+ ARR cohorts, and were more conservative:
Related: More on the Pavilion 2024e forecasts
2024 Forecasts: More Late Stage Weakness...
These growth rates stood out as weak:
+15% for $10m-$20m ARR
+10% for $50m+ ARR
Again, Gartner's SaaS industry-wide 2024e forecast is +18.9%.
That Gartner estimate includes companies at larger ARR bases that should have lower growth rates relative to $10-$20m scale SaaS.
For comparison, here are the Pavilion member 2024e forecasts (albeit at different ARR cohorts):
2024 Forecasts: Rule of 40 Weakness
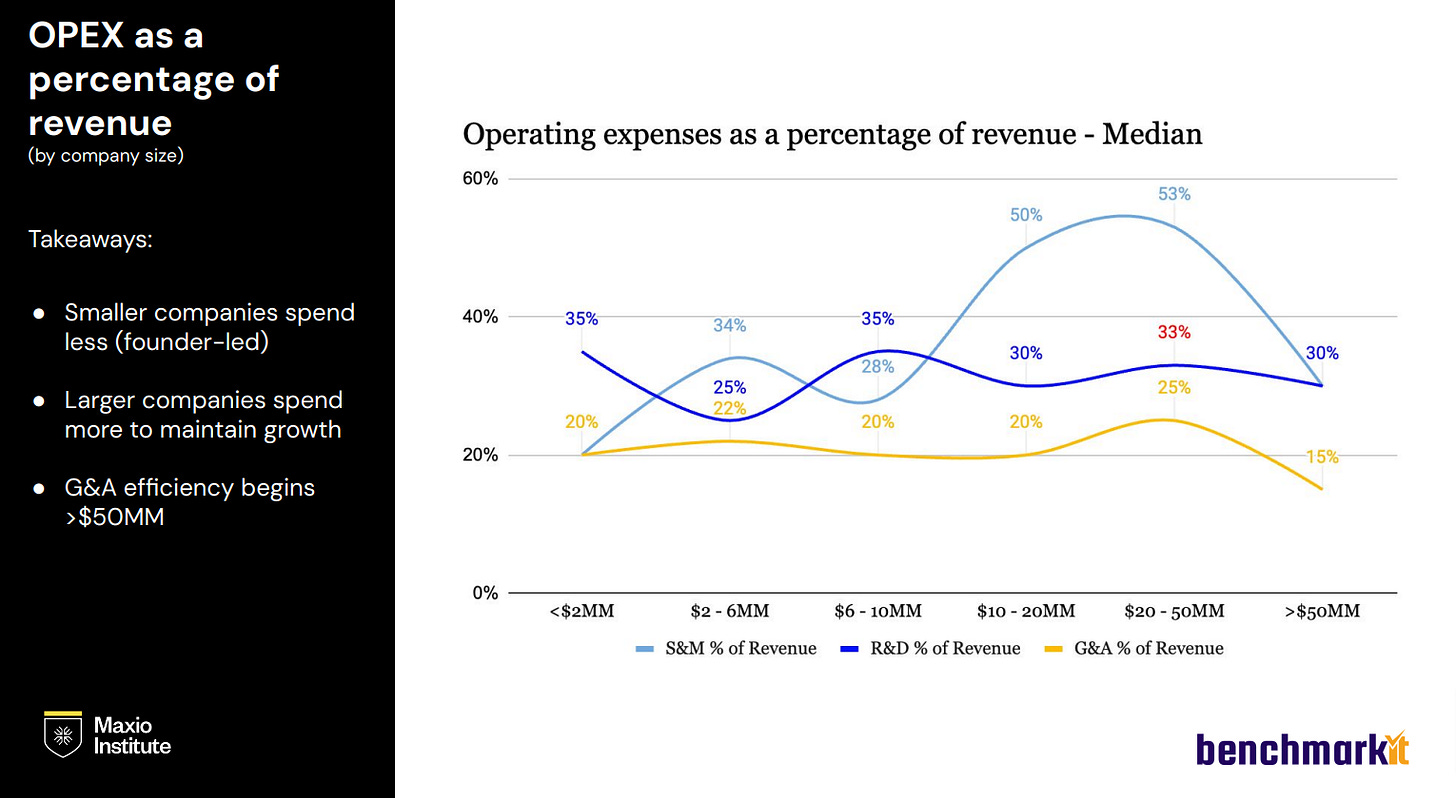
Helpfully, the Maxio / Benchmarkit survey included cost structure by size:
The level of Sales + Marketing spend (50%-53% of revenue) for the $10m-$20m and $20-$50m stood out on an absolute basis, let alone relative to the forecasted growth from this elevated GTM spend.
Combining this OpEx chart with the revenue forecasts we arrive at these Rule of 40s (assuming 75% gross margin):
<$2m Ro40: 50 (50% growth + 0% margin)
$2m-$6m Ro40: 37 (43% growth + -6% margin)
$6m-$10m Ro40: 19 (27% growth + -8% margin)
$10m-$20m Ro40: negative 10 (15% growth + -25% margin)
$20m-$50m Ro40: negative 5 (31% growth + -36% margin)
>$50m Ro40: 10 (10% growth + 0% margin)
To frame these Rule of 40's, here are our historical SaaS benchmarks via (aggregating KeyBank + Pacific Crest reports; downloadable historical SaaS benchmark slides):
Using Meritech Capital's public comps table, here are public company Rule of 40's by size:
<$500m ARR: 17 median
$500m-$1b ARR: 28 median
>$1b: 40 median
Takeaway: very weak Rule of 40 metrics in Maxio / Benchmarkit 2024e forecasts
Trends by Category
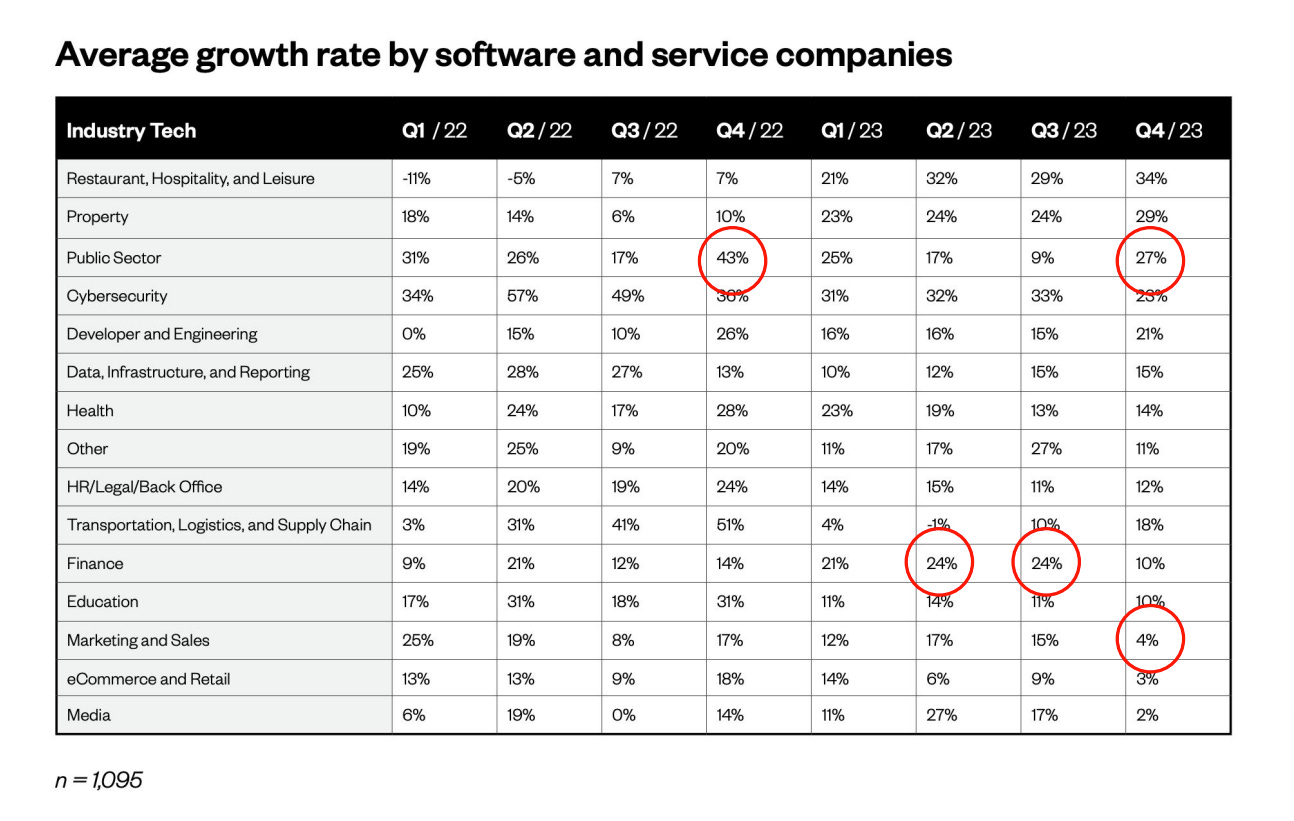
Maxio's category-level detail is very consistent with what we have observed in our above Demand Index:
Security: Strong #1
E-Commerce: weakest
Maxio included great granular breakdowns by category:
Since our Demand Index is less stratified and covers different categories, they are not fully comparable. That said, there are commonalities:
Finance + ERP: also accelerating in 2H 2023
DevOps + IT: below average in Maxio data + Demand Index
While not shown in our Demand Index, company-level trends also mirror Maxio, like:
Restaurants + Hospitality: Toast and Tripleseat data have been positive in the Demand Index
New Cloud Ratings Product: True ROI
Our Cloud Ratings category quadrants are now complemented by True ROI reports.
Our first True ROI report covers RELAYTO, a software suite that turns static files into interactive web-based content experiences.
Customer interview results were translated into a True ROI financial model with quantitative benefit and cost estimates, reflecting a 3-Year ROI of 4,748% (47x) and 2.0-month payback:
True ROI Reports can help you quantify and provide 3rd party validation of your software product’s business value.
If interested in learning more, consider booking a demo with me:
If a demo is too much, but you would like to learn a bit more by email, click here.
*In an effort to publish closest to month end, we are accessing the underlying API data “early” (relative to the typical SEO and PPC users that do not require such immediacy). Therefore data should be considered “provisional” (i.e. subject to revision by our data provider) and create volatility in the data presented in the 2 most recent months. For this month, Zoom was excluded due to nonsensical data via the API; the historical data presented, however, is also pro forma to exclude Zoom.
This report was first published on cloudratings.com.


