Drivers of Customer Satisfaction + Category Leadership
NPS + Market Share Drivers Analyzed For 4,222 Software Companies
Building on our “Platforms Versus Pure Plays” primary research, we’ve partnered with G2 to examine the drivers of customer satisfaction for software.
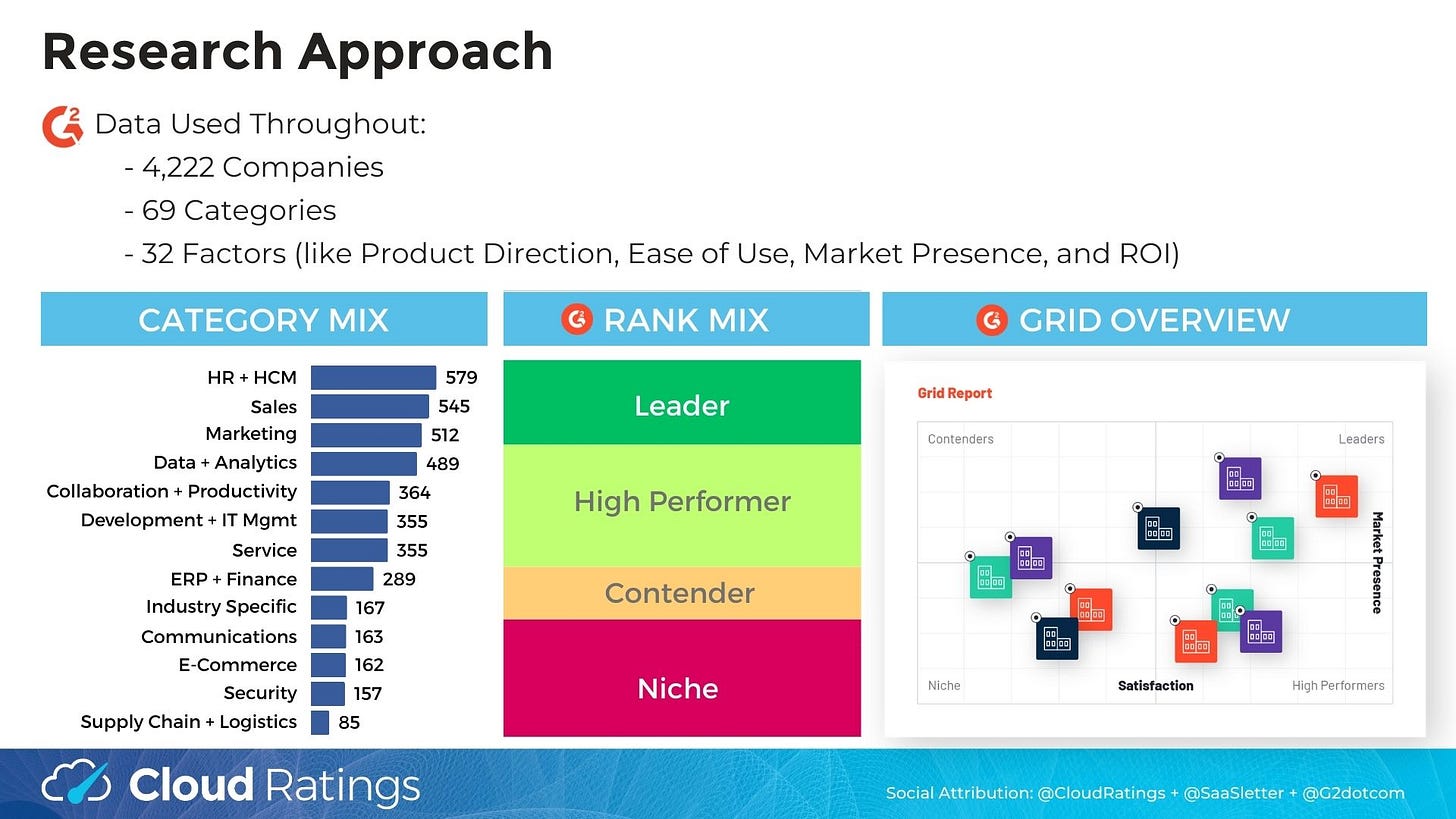
Using 135,000+ total data points from 4,222 software companies featured in G2 Winter 2024 Grid Reports, we performed over 50 regressions to understand the drivers of customer satisfaction.
What Drives NPS?
6 factors showed a statistically meaningful correlation with Net Promoter Scores (NPS):
Quality of Support
Meets Requirements
Ease of Doing Business
Ease of Use
Ease of Set Up
Product Direction
3 factors showed some signal:
ROI: This is an example of the disconnect between software users and buyers. A user does not particularly care about software's cost (and thus ROI) if it improves their day-to-day work experience.
Months To Go Live: The data showed High Performers go live 26% faster than average. With Leaders 1% faster than average.
Year Founded: As we will cover later, maintaining customer delight over long periods of time is a challenge, especially against younger competitors.
Of note, Adoption did not show any significance in terms of NPS. Since software utilization statistics are not widely disclosed or well standardized, a 70% utilization rate (very common) might cause undue concern regarding NPS and product viability. In fact, low utilization can be good:
“The fire extinguisher in your kitchen hopefully has low utilization. But when you need it, you need it.” - Scott Brinker
Many regressions showed nearly zero significance against NPS - like customer size mix, number of vendor employees, contract term, or vendor Glassdoor rating.
NPS Reveals Market Leadership
For context, G2 Grids classify software vendors into the following categories:
Leaders: high market presence, high satisfaction
High Performers: lower market presence, high satisfaction
Contenders: high market presence, lower satisfaction
Niche: lower market presence, lower satisfaction
While the difference between vendors ranked as Leaders and High Performers versus Contenders and Niche appears modest at the individual user experience factor level, cumulatively, they produce a large NPS gap.
Brex Perspective
Brex is a partner of the SaaSletter newsletter
So what are the characteristics of a good software vendor? Or better yet, what would make someone proactively sell a colleague or peer on that vendor? A slick product is a great hook, but it’s really how that company shows up that keeps them reeling in new business.
Technology is a fickle thing. Solutions don’t always work as they should, or maybe they aren’t as intuitive to get started. The best software vendors not only meet expectations but repeatedly exceed them. And even further, they designed their businesses that way.
You’ll see in the next section some of the characteristics of NPS winners, but one thing that’s notable: older companies tend to have lower G2 review scores. That’s likely a byproduct of having more iterations of a product or platform, but it’s also telling of how valued their customers feel.
Much like the Titanic trying to turn to avoid the iceberg, big companies are too slow-moving to steer clear of the customer service pitfalls that turn raving fans raving mad. And today’s software organizations build entire playbooks around being better at serving their core audiences.
In financial software, new competition hits the market every day because the legacy, monolith companies cannot show up in the way that today’s customers need them to. Even starting with something as basic as 24/7 customer support, which is notably absent in the complex global fintech space, sends a powerful message. That’s why Brex has had so much success as an alternative to Concur.
Some anecdotes culled from the Brex website reflect a software company that continues to show up for its customers:
"Brex has the best support team I have ever experienced from a software company — and I have been part of several implementations." — Cindy Nunez, Senior Accounting Manager, DoorDash
"With Brex’s 24/7 in-app support, the finance team doesn’t have to spend time answering questions or overseeing the process.” — Arlene Barbieri, Corporate Financial Controller, Medicinal Genomics
“Users have total visibility into their spend with Brex. Everything is self-serve, so we’re also saving hours on troubleshooting. But, when employees have questions, they can chat, call, or email Brex Support 24/7. I recommend Brex to all my colleagues.” — Natalie Dircks, Senior Accountant, Triage Staffing
You can read more about what Brex President Karandeep Anand believes it takes to serve customers in the spend management landscape and why obsessing over the customer and their challenges is the only North Star any company will ever need.
The bottom line: The best software companies are the best customer service vendors. And they will print money because they’ve taken a glaring weakness and turned it into their core strength.
What Else Separates Market Leaders?
With a caveat regarding the limited statistical significance outside the top 9 factors shown in the NPS regressions above, some interesting patterns emerge when comparing G2 Grid ranks by other factors.
The most striking difference: the relative size of Leaders and Contenders.
G2’s “Market Presence” factor evaluates the product's and vendor's presence in the market, focusing on product-specific metrics. This score is influenced by various factors, including the number of reviews, employee count, revenue, and web presence.
Leaders and Contenders are ~1.8x larger than their lower satisfaction peers on a Market Presence basis.
Why does this matter? The size gap suggests the software industry has “winners take most” or at least “winners take more” dynamics.
We also examined Market Presence by Age (or Market Presence divided by Years Old) as a proxy for market share efficiency.
Market share efficiency is directly in line with the G2 Ranks:
Leaders: By far most efficient
High Performers: high customer satisfaction drives faster market share gains
Contenders: lower efficiency due to slower growth and/or lower customer satisfaction
Niche: lowest efficiency
Our findings also align with Scott Brinker and Frans Riemersma’s “Martech in 2024” research focused on marketing technology software:
Age: older companies tend to have lower G2 review scores
Revenue: the very largest vendors ($1+ billion of revenue) have an outsize mix of the weakest review scores
Key Messages
Primary research does not always yield surprising results. Our analysis of over 4,200 software companies and 135,000 data points confirmed: Category leaders really do lead.
Leaders and High Performers have superior customer satisfaction and NPS scores relative to their Contender and Niche counterparts. The underlying data and patterns also seem to validate the ability of G2’s Grid model to rank software products.
Our regressions found these 6 factors to be the strongest predictors of NPS:
Quality of Support
Meets Requirements
Ease of Doing Business
Ease of Use
Ease of Set Up
Product Direction
Downloadable Slides
Appendix: Additional Findings
Customer Mix:
Customer size did NOT show any statistically significant relationship with NPS (with r-squares ranging from 0.00 to 0.05).
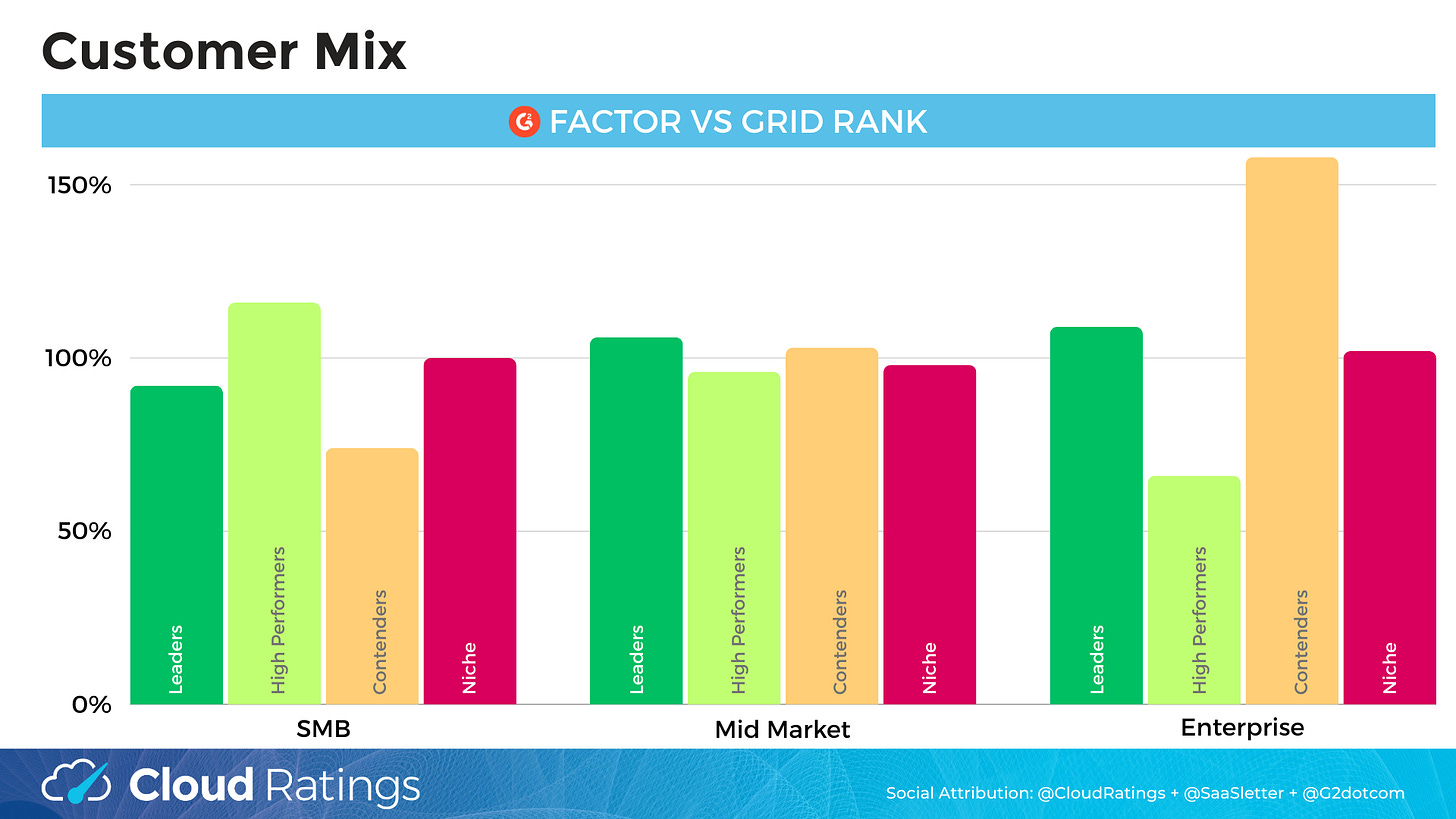
Nonetheless, understanding customer base types across the G2 Grid types is at least interesting. In our indexed analysis, the key highlights were:
High Performers: A much higher proportion of SMB customers and a much lower enterprise mix. This aligns with the narrative of breakout apps “making their name” first with small businesses.
Contenders: Significantly higher mix of enterprise and much lower for SMB. Combined with the much older age of Contenders (24 years old vs. 10 years for High Performers), this fits with enterprise customers’ tendency to work with long-established vendors.
Implementation + Deployment:
We also examined the impact of implementation and deployment on NPS. A few highlights:
Time To Live: This was the only factor with any statistical signal (r-square of 0.13). High Performers are implemented fastest (1.6 months) and Contenders are slowest (3.2 months).
Implementation Team: Leaders have a significantly higher share of implementation done by 3rd party consultants. In terms of correlation versus causation, *perhaps* this is a function of 3rd party consultants only establishing practice areas for vendors with high market share like Leaders and Contenders. Contenders have a significantly higher share of implementation performed by their own seller services teams.
Cloud vs On-Premises: Niche vendors are somewhat more likely to be on-premises.
Related Research
If you’ve read this far, you likely would enjoy our “Platforms vs. Pure Plays" research with G2:
SaaSletter - Platforms vs Pure Plays
Approach: Used G2 Data To Analyze 12 Software Categories With Clear Platform vs Pure Play Dynamics, Representing 46 Companies
This “Drivers of Customer Satisfaction + Category Leadership” research was first published on cloudratings.com


