
SaaSletter - January 2024 SaaS Demand Index
Plus updated Cloud Cost Optimization data

January Demand Index
We’re excited to update the SaaS Demand Index with data through January 2024.
For our new readers: the Demand Index is derived from high-intent (aka “okta pricing”) Google Search volume data for 339 companies, covering 350,000+ searches.
Reminder: this is a directional, free, and ever-evolving* analysis → always do your own due diligence.
Moreover, the data captured here is best characterized as top-of-funnel or dark funnel → factoring in sales cycle length, do NOT use this Demand Index as a predictor of near-term financial results and/or financial guidance.
Industry-Wide Data
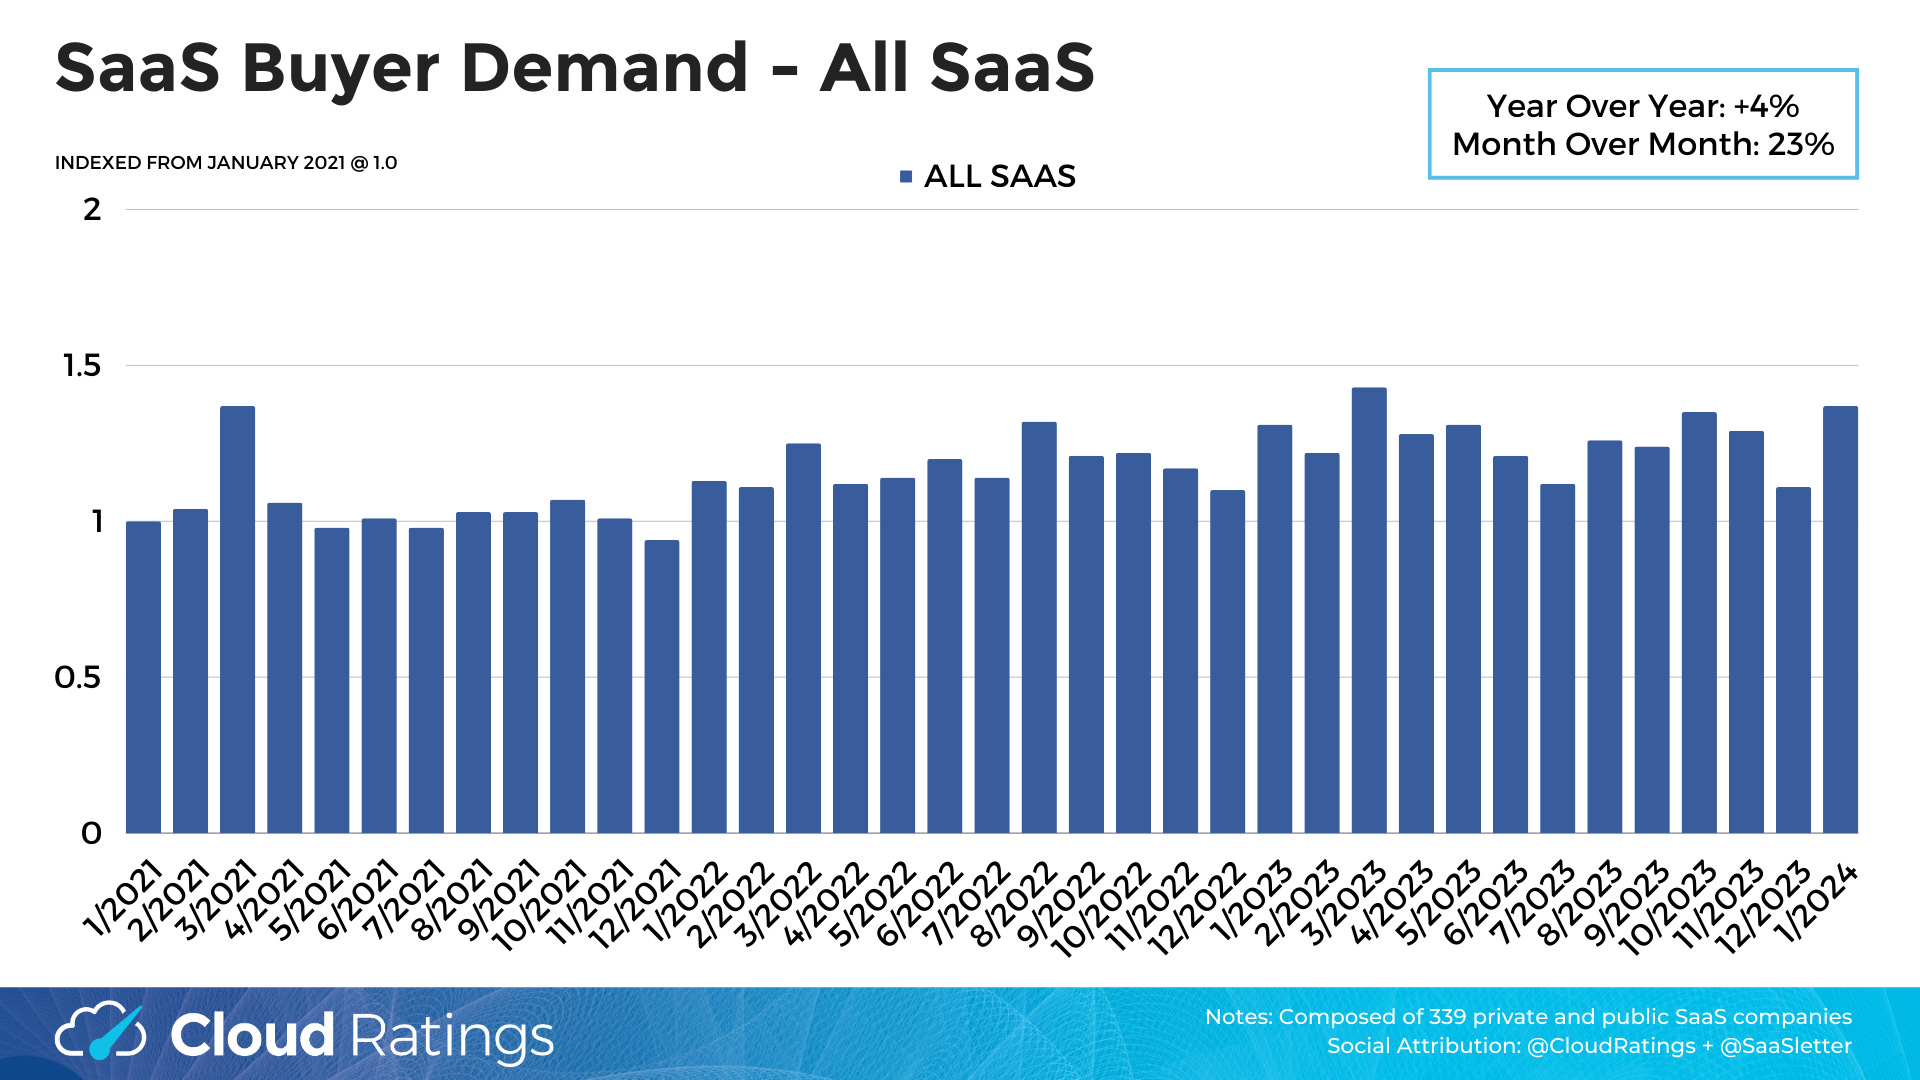
High-intent search volumes were up +4% year-over-year.
Relative to expected industry growth rates for SaaS (Gartner at +19% industry-wide for 2024), these trends remain underwhelming.
Given extreme seasonal impacts in December, consider the 23% month-over-month figure irrelevant.
Trends By Product Category
Zooming out to recap almost three years of data on our cumulative growth since January 2021 slide:
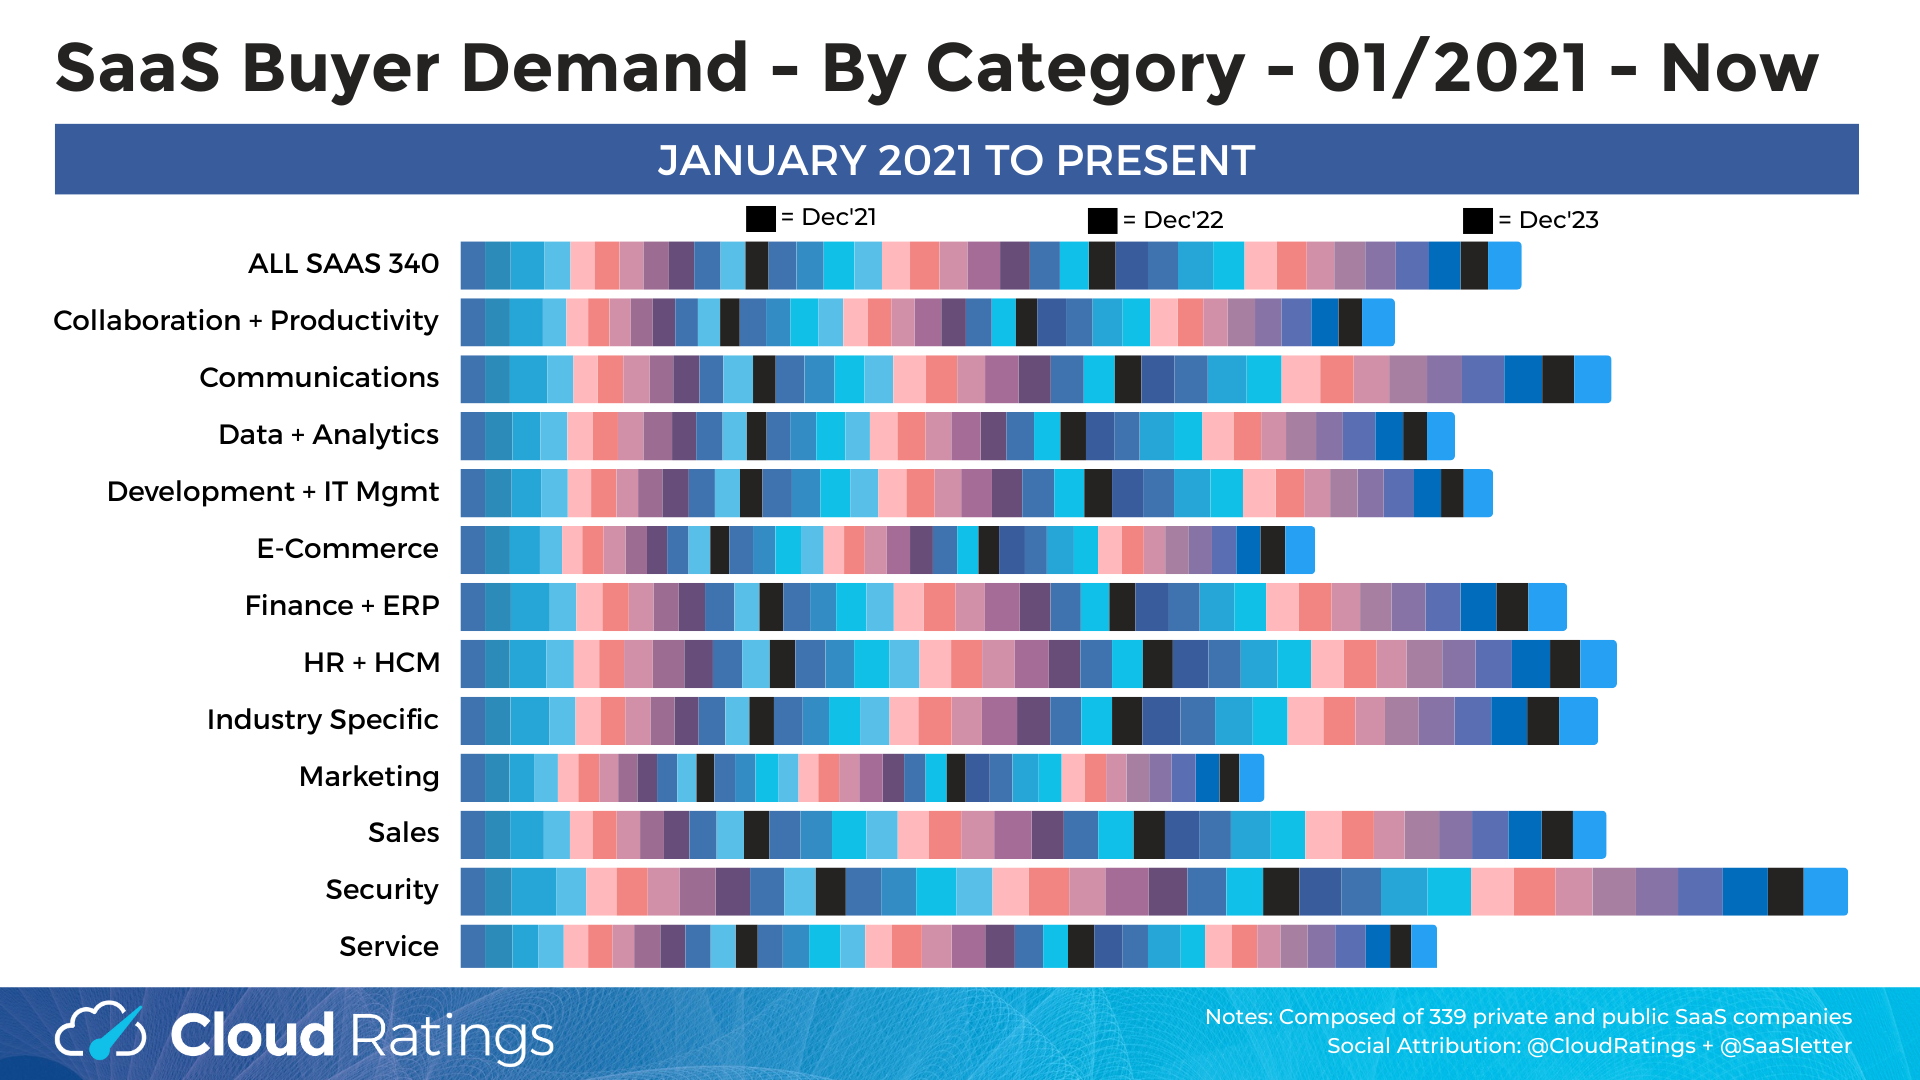
This slide presents growth for the last month and last three months, respectively:

Callouts from the January and last 3 months’ data:
Data + Analytics: Remains weak versus CIO survey commentary on investments in data tools to better enable upcoming AI investments.
Above Average Performers: Like last month, the strong performers were Communications, Finance + ERP, HR + HCM, Industry Specific / Vertical, and Security
All of the category drill-downs - like this Finance + ERP example - are available in this slide PDF:

High Performing Vendors
These vendors have shown the greatest acceleration over the past 3 months:
Bigtime, Thryv, Dayforce, Jobber, Tripleseat, Rainforest QA, Floqast, Celonis, Quickbooks Online, Intapp, Precoro, Realpage, RevenueCat, Vena, Vlocity, Klaviyo, Hubspot CRM, Xero, Gorgias, Rollworks
Publicly traded bolded for the convenience of our investor readership.
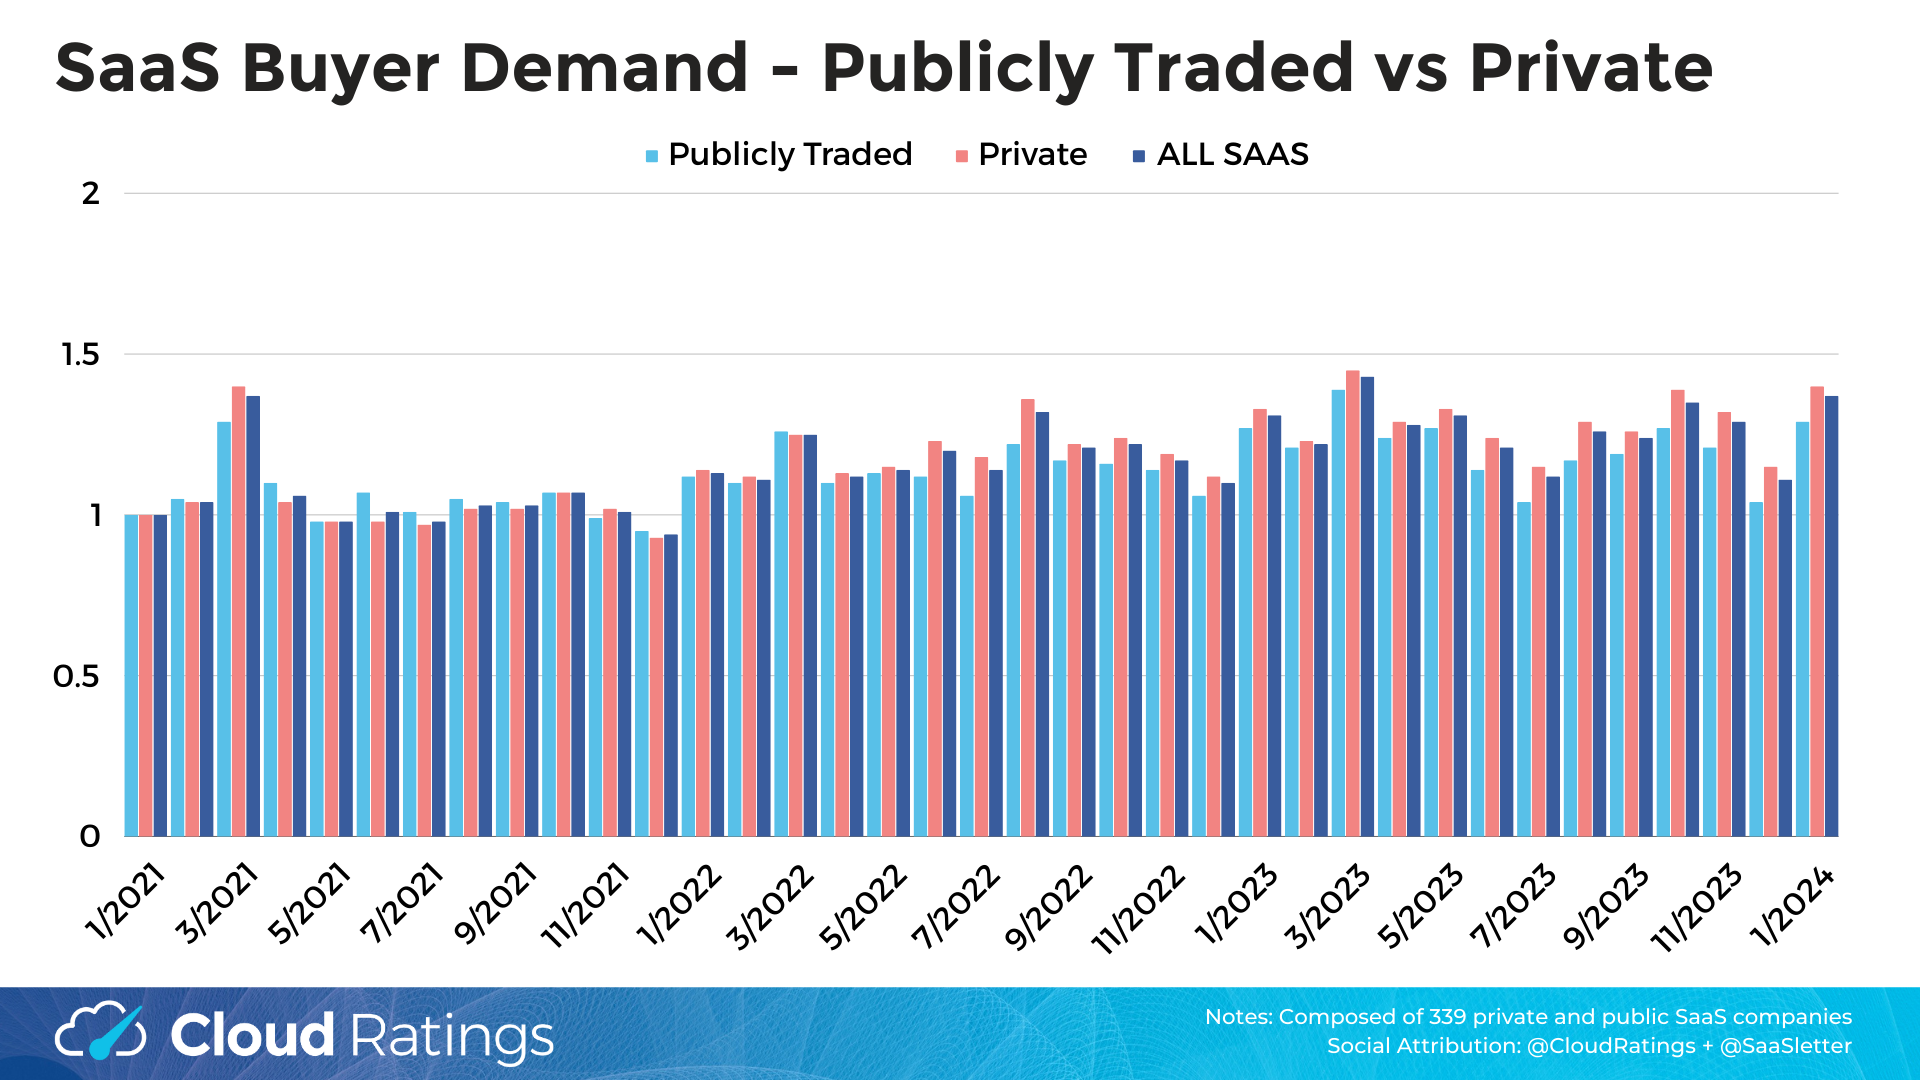
Other Trends
By customer mix, SMB has generally outperformed Enterprise recently:

Private companies have been outperforming publicly traded SaaS of late:
Cloud Cost Optimization Trend Update
We’ve covered earlier earnings season commentary from Amazon, Google and Microsoft on abating cloud cost containment trends…
Which Datadog also noted on their Q4 2023 earnings call:
We also note that the greater intensity of optimization we've seen over the past 6 quarters appears to have dissipated. For the last couple of quarters, we have discussed with you a cohort of customers who are optimizing. In Q4, this core usage grew at a faster pace than the broader customer base. We take this as a positive sign.
To be clear, we see optimization activity with our customers every quarter. We expect them to continuously make sure they are using their cloud efficiently, and we'll keep helping them do that. And we do still see attention to costs in certain parts of our customer base. But overall, we see less headwinds than we did a few quarters ago.
These company comments seem consistent with cloud cost optimization Google search trends we track: down 1% year over year:

Again, note that December seasonality means month-over-month is a poor metric.
*In an effort to publish closest to month end, we are accessing the underlying API data “early” (relative to the typical SEO and PPC users that do not require such immediacy). Therefore data should be considered “provisional” (i.e. subject to revision by our data provider) and create volatility in the data presented in the 2 most recent months. Going forward, Zoom has been excluded due to nonsensical data via the API; the historical data presented, however, is also pro forma to exclude Zoom.
This report was first published on cloudratings.com.