
SaaSletter - New Jan'23 Demand Index Data
Was January a "green shoot" for SaaS Top of the Funnel (TOFU)? Or seasonal?

With the latest data just in, I’m excited to update the SaaS Demand Index with data through January 2023.
Reminder: this is a directional, free, and ever-evolving analysis that I’m open-sourcing → always do your own due diligence.
Industry-Wide Data

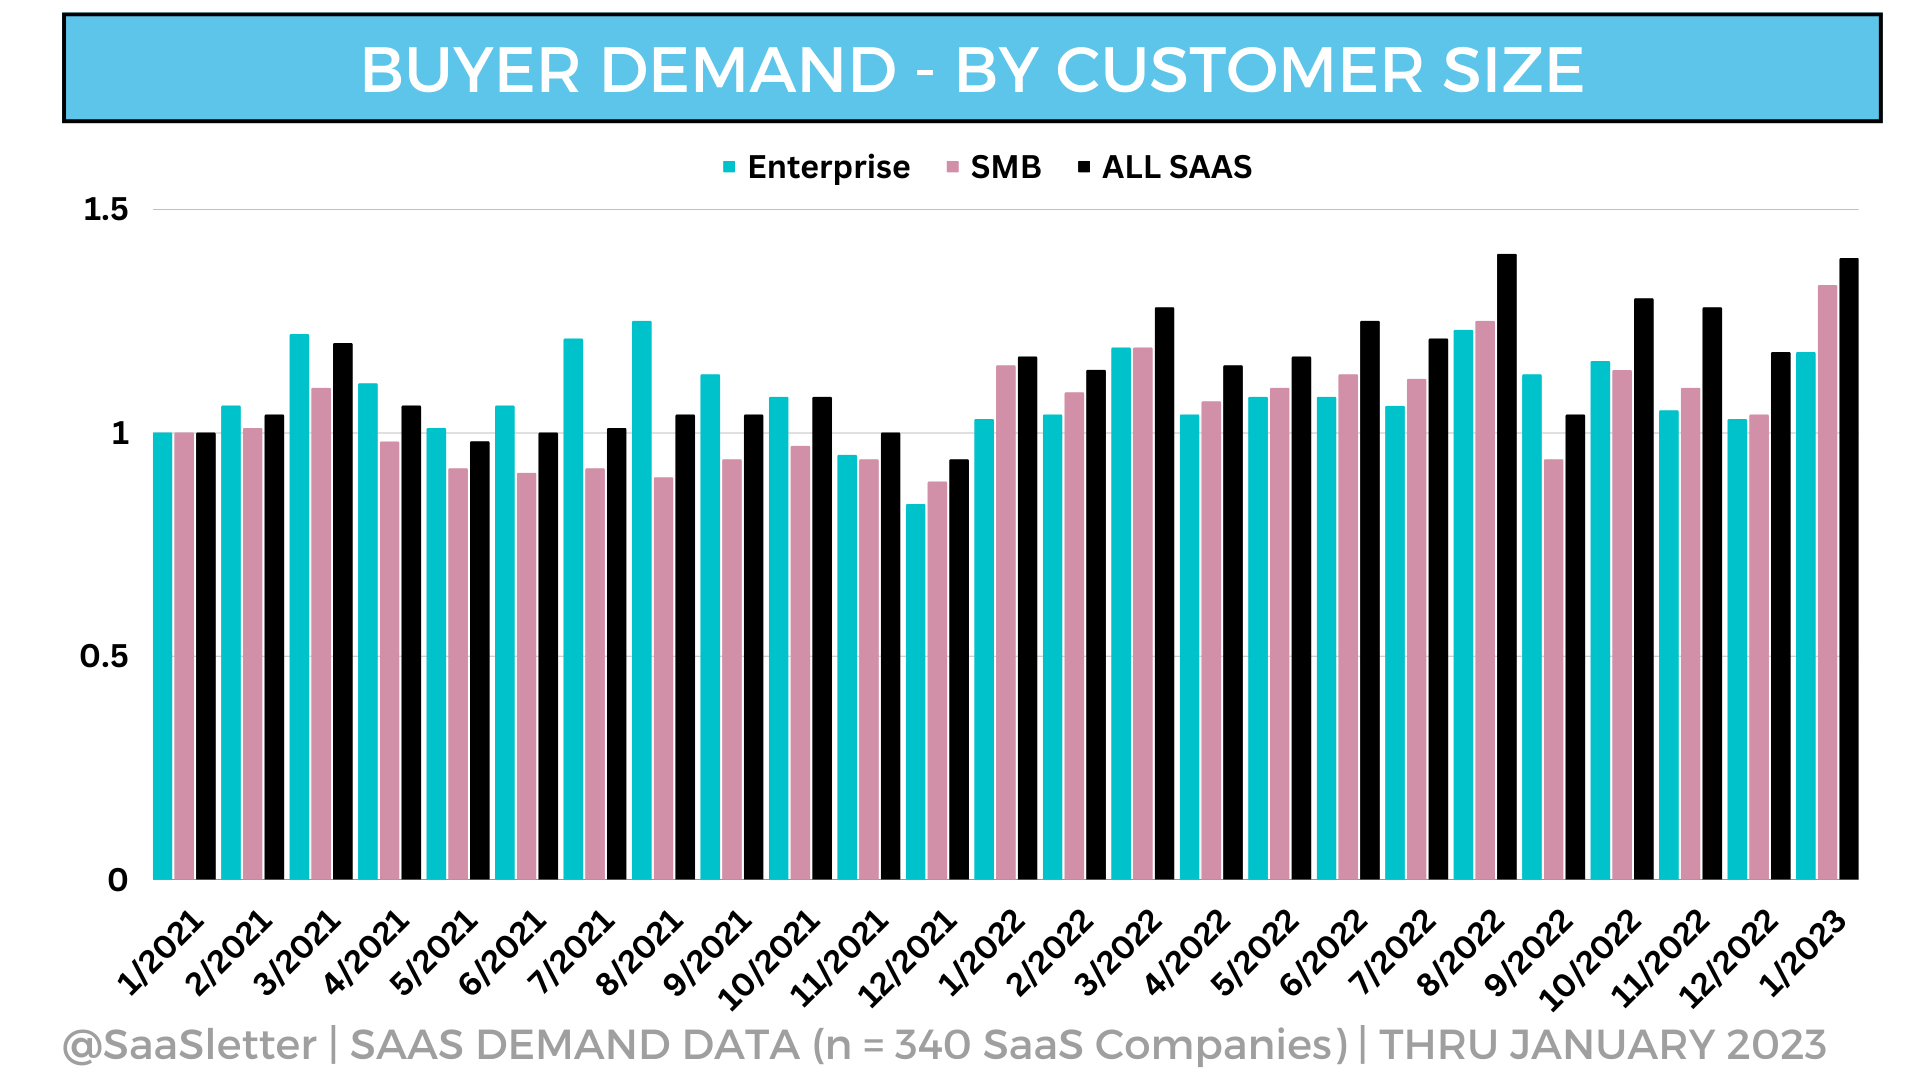
January high-intent search volumes came in surprisingly strong.
Our data source is NOT seasonally adjusted. However, I’ve laid out a broader data set to set the context for January seasonality.
The January "spike” (likely a combination of moving past the holidays AND the fiscal year ending Jan 31 sales cycles) looks to be a repeating trend, including 2023.

Trends By Product Category

Once again, Development + IT Management and Security are the strongest performing categories on an LTM basis. That said, Development + IT Management is decelerating.
E-Commerce and Marketing continue to lag behind the industry but show some signs of rebounding.
A few comments on notably strong last 3 month + January trends:
Industry Specific (aka Vertical Software): driven by Jobber, BuilderTrend, Bloomerang, Blackbaud, and Accelo
HR + HCM: notable strength from Checkr, Paycor, Absorb LMS, and Deel
Selected drill-down pages are published below…
while all of the category drill-downs are available in this PDF.
Selected High-Performing Categories:


Selected Lagging Categories:


Ad Pricing + Competition
Comparing January 2023 to October 2022 (to eliminate the December lull impact), the weighted average cost per click (CPC) for the industry increased in the high single digits…
…and the level of ad competition declined in the mid-teens.
Methodology Refresher

Driven by high-intent Google search data (i.e. "okta pricing")
Developed using a commercial SEO software suite
n = 340 SaaS companies - Selected for representation (by category, company stages, by customer type) to approximate the overall industry
Given the typical sales cycle, consider this a rough PROXY for top-of-the-funnel demand ONLY and NOT indicative of near-term bookings/revenue
Even More SaaS Content
“The Dark Knight of Software's Multiple Floor” - Bullfight Cap Substack - an excellent, excellent post on software private equity, including these charts:


The January 2023 sales quota attainment from RepVue continues to be weak:
And efforts to contain cloud spend are on the rise:
