First: An M&A Podcast With Software Equity Group
VIDEO | AUDIO: Apple Podcasts | Spotify | All Platforms
To fill a gap in an otherwise robust Founder content ecosystem, we recorded an episode with a pure-play M&A boutique - Software Equity Group - covering the full M&A cycle - from prep to closing - of selling your company, what drives premium multiples, and common mistakes to avoid.
Related Reading: SEG’s “20 Factor Valuation Scorecard” deserves more attention:
My Notes From Meritech’s “Software Pulse”
In addition to their excellent comps table, Meritech’s “Software Pulse” newsletter is worth subscribing to.
A few of my notes from their most recent edition:
It All Comes Back To GTM:
The difference in Payback Periods is striking: 16 months for the top quartile and 72 months for the bottom. The other metric gaps - like ARR growth, NRR, and Rule of 40 - are logical and in the right order, but nowhere near as notable.
Where Do Returns Come From?
In the above chart, you see the post-IPO returns concentrated in the top half (33% for the top quartile, 17% for the second quartile), with underwhelming, even negative returns for the rest.
Back in the lows of November 2023, this returns distribution was even more top-heavy: flat to down returns outside of the top quartile.
That said, returns concentration happens outside of modern SaaS - over the long run, 4% of stocks really matter:
Hendrik Bessembinder, a finance professor at Arizona State University, found that just 4% of stocks produced all the net dollar wealth creation in US equity markets over the nearly century-long period from 1926 to 2019. The other 96% of stocks, in aggregate, added no value over their respective lifetimes.
Why Are You Writing About This? The IPO Window
As IPOs (kind of) return, so will various IPO takes. For example, some investors are “talking their book” about the great backlog of $200m-$300m ARR companies ready to list.
I have long agreed with Ricky Sandler (Founder/CEO/CIO of Eminence Capital) on what changes in equity market structure mean for smaller IPOs:
… which is consistent with the Meritech data: negative post-IPO returns under $700m ARR.
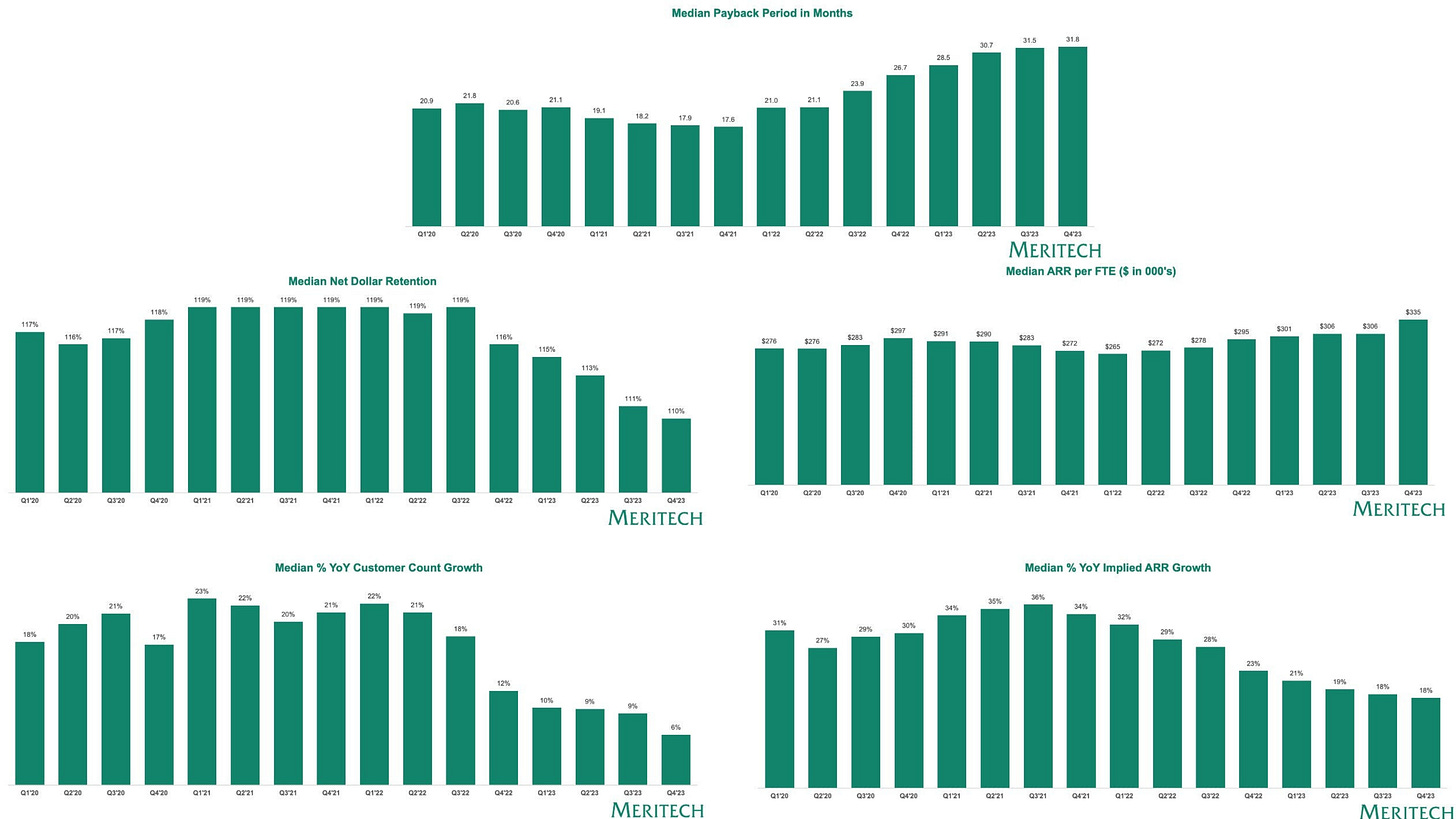
Lastly, the aggregated industry metrics - like NRR, ARR growth, and payback - through Q4 2023 in the “Software Pulse” fit into a theme of stabilization/plateauing, although the customer growth trends (+6%, vs +9% Q3’23) are concerning:
2024 Benchmark Participation
Cloud Ratings + this newsletter are serving as a partner to drive submissions for Ray Rike + Benchmarkit’s 2024 SaaS Benchmark report (for 2023, n = 1,800+ → so one of the largest reports in the industry):
March 2024 Quota Attainment via RepVue
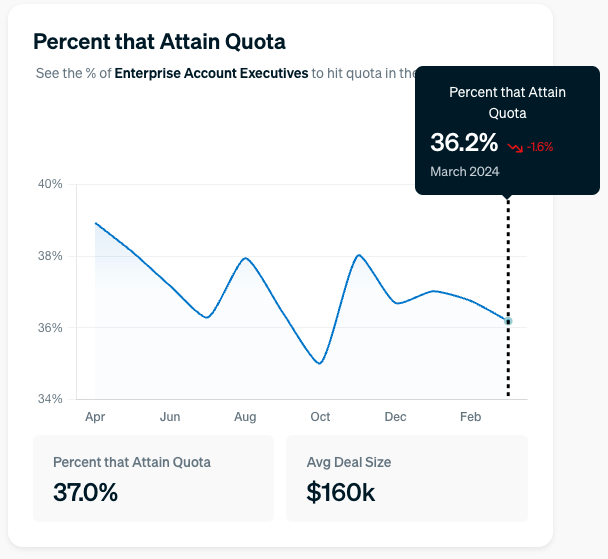
March 2024 quota data was relatively weak, with more roles down than up.
A full recap across 6 seller roles - like Enterprise AEs, SDRs and Sales Engineers - is available here.


