SaaSletter - R&D Engineering -> Financial Engineering
Translating ICONIQ's R&D benchmarks into steady state cash flow
ICONIQ R&D Benchmark’s
My financially-oriented highlights of their “Engineering in a Hybrid World” 35 slide deck from October 2022.
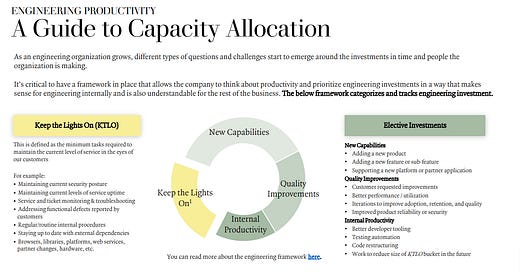
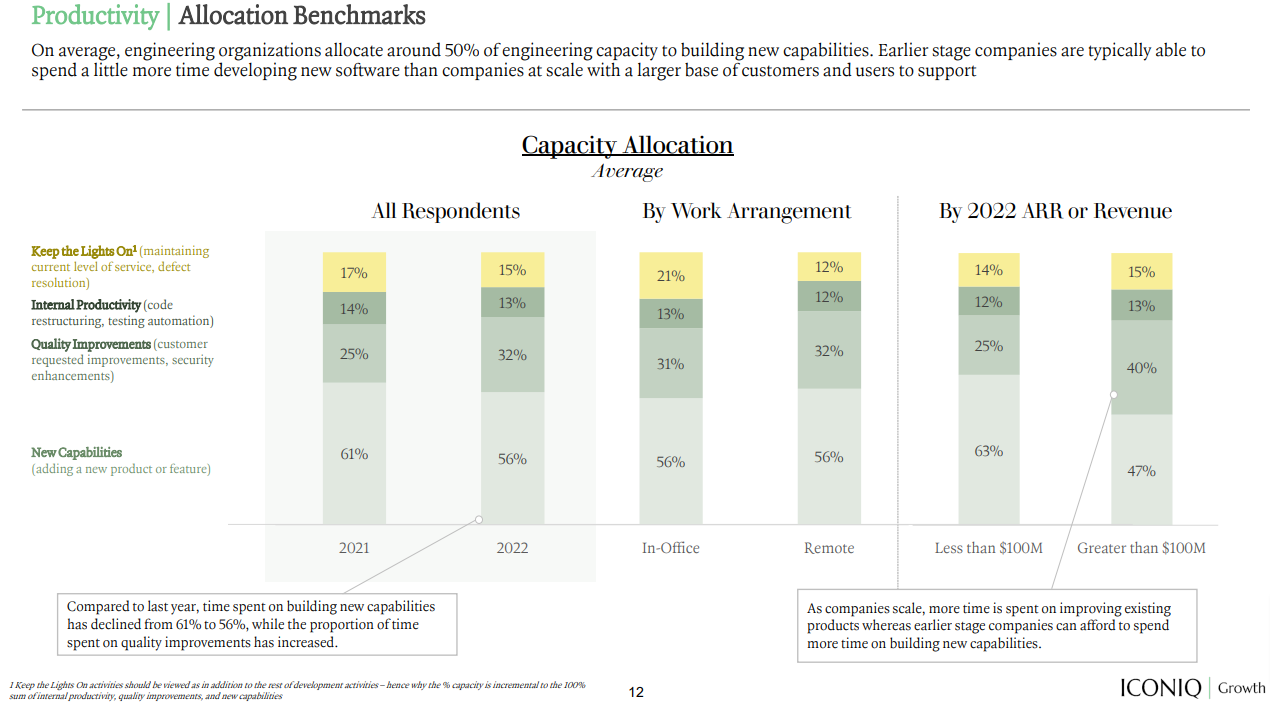
A rare granular break-down of how the R&D income statement line item translates to product development:
My biggest call out: 47% of R&D spend = “New Capabilities (adding a new product or feature)” (for ARR > $100m)
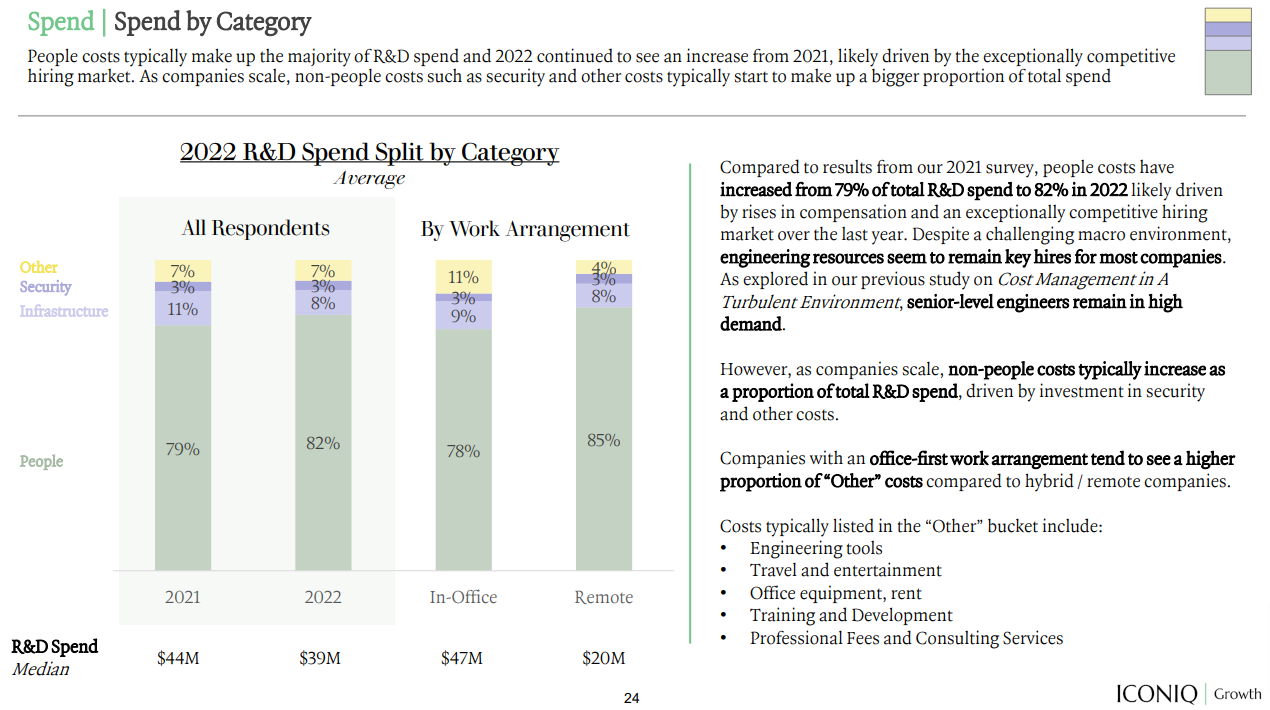
Flagging the spend by category data - 82% people - alongside ’s recent “Focus On People Costs”
There is a LOT more in the report like
Engineering Headcount Ratios
Developer mix (back-end vs front-end vs full stack)
Remote vs in-office
Use of 3rd party and offshore R&D resources
R&D headcount by role (QA, Data Science, Architects, PMs, Management, and so on)
Translating R&D Benchmarks To Long-Term Margins
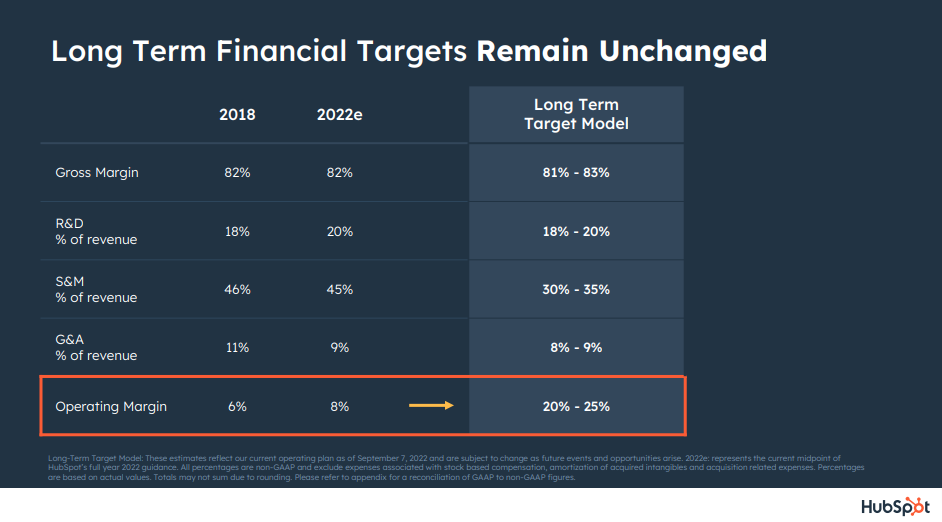
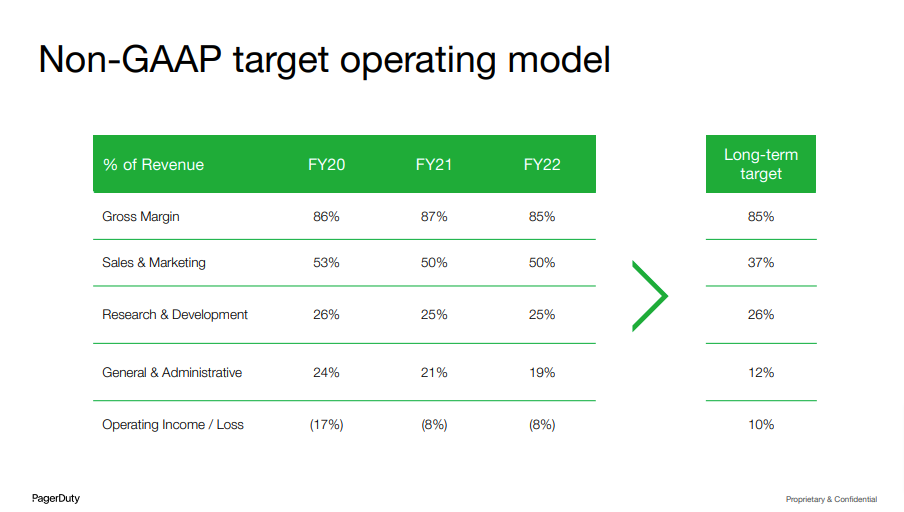
Amongst public SaaS stocks, company-guided “long-term target operating models” rarely contemplate reducing R&D spend all that much. Examples from Hubspot and PagerDuty are included below.
Generalizing, the margin bridge is primarily driven by improvements in Sales & Marketing plus a few hundred BPS from G&A leverage.
Related Resources:
Interestingly, Morgan Stanley’s “Margin X-Ray” earnings-power framework does NOT assume R&D reductions - May 2022 example here.
RBC’s Summary of Long-Term Targets across their software coverage (via @Jerry Capital)
Why Does This Matter?
Let’s go back to the ICONIQ report.
We saw 47% of R&D spend = “New Capabilities (adding a new product or feature)”
Arguably the next category is equally important from a cash flow-oriented investor viewpoint (aka many of our private equity newsletter subscribers):
40% of R&D spend = Quality Improvements (customer-requested improvements, security enhancements)
When modeling out a downside or “run for cash” scenario, the "quality improvements” *seems* to allow for reasonable logo retention and NRR with a software product that is responsive to customer needs.
Something like a 90% logo retention rate + plus 3-5% annual pricing = 95% NRR???
While stopping new feature development would obviously lower your revenue growth rate, this *theoretical* analysis suggests:
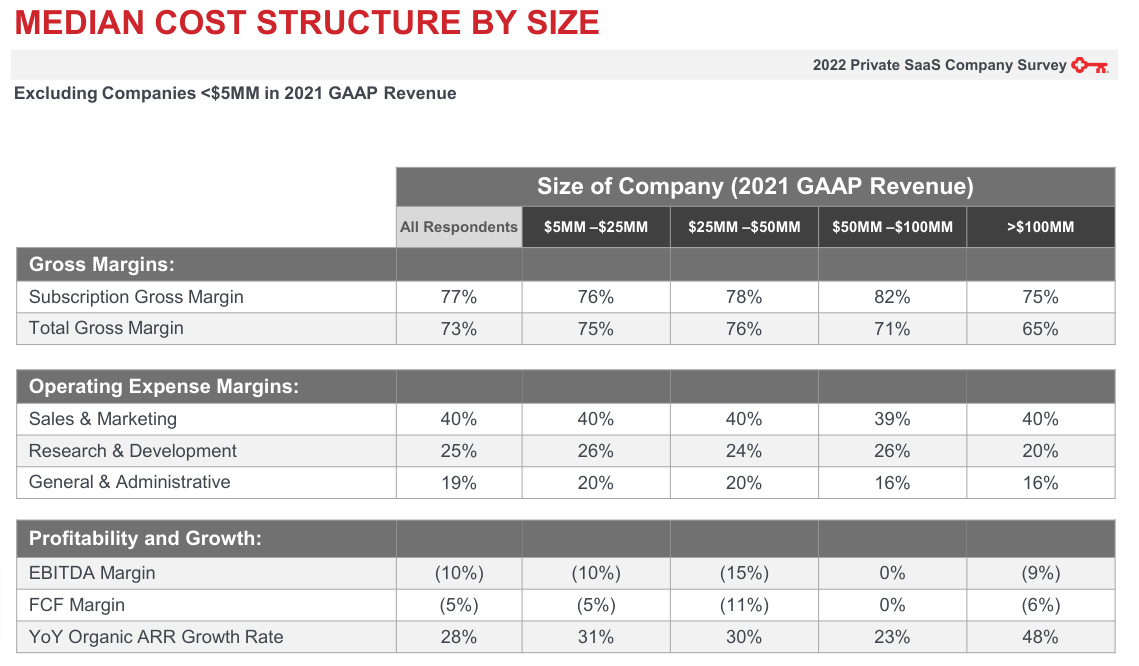
25% revenue on R&D (KeyBank below)
x 53% (i.e. 100% - 47% New Capabilities R&D)
= 13% operating margin improvement via R&D
Taking a very mechanical approach, that also implies new product capabilities should add at least 13% to your revenue growth rate; if not, growth R&D is dilutive to your Rule of 40.
Curated Software Content
This post from
on software developer purchasing patterns flagged the ICONIQ report too:Other highlights:


