
SaaSletter - May 2024 SaaS Demand Index
Plus Our May SaaS Employment Index

May Demand Index
We’re excited to update the SaaS Demand Index with data through May 2024.
For our new readers: the Demand Index is derived from high-intent Google Search volume data for 340 companies, covering 375,000+ searches each month.
Slides here:
Reminder: this is a directional, free, and ever-evolving* analysis → always do your own due diligence.
Moreover, the data captured here is best characterized as top-of-funnel or dark funnel → factoring in sales cycle length, do NOT use this Demand Index as a predictor of near-term financial results and/or financial guidance.
Industry-Wide Data
High-intent search volumes were up +4% month-over-month and +17% year-over-year.

When combined with February 2024’s +17% YoY reading and April’s +15%, this may mark a shift from the doldrums of June 2023 to January 2024. Notably, RepVue’s forward-looking Lead Flow metric also showed a weak 2H 2023, with *some* signs of a Lead Flow upturn in 2024 (example, example, example)

The new YoY graph above compares the high-intent search trends to Gartner’s 2024 cloud spending forecast only to give context. In the footnotes, we note possible “apples versus oranges” dynamics when comparing the SaaS Demand Index versus Gartner.**
Enhanced Demand Index View + SaaS Alt Data Beta

We have received consistent inbound interest from investors looking to license our Demand Index data.
In response, we are evaluating commercializing an Enhanced Demand Index, which offers broader and more nuanced coverage of intent signals, as a portion of a larger alternative data-style research product.
During this earnings season, we have been performing regressions using the Enhanced Demand Index, which is showing a similar upward trend to our “basic” Demand Index (see green lines in the examples above + slides linked here).
To build the best possible product, we will be conducting surveys with investors. If interested in participating, please register below:
Trends By Product Category
Zooming out to recap almost three years of data on our cumulative growth since January 2021 slide:
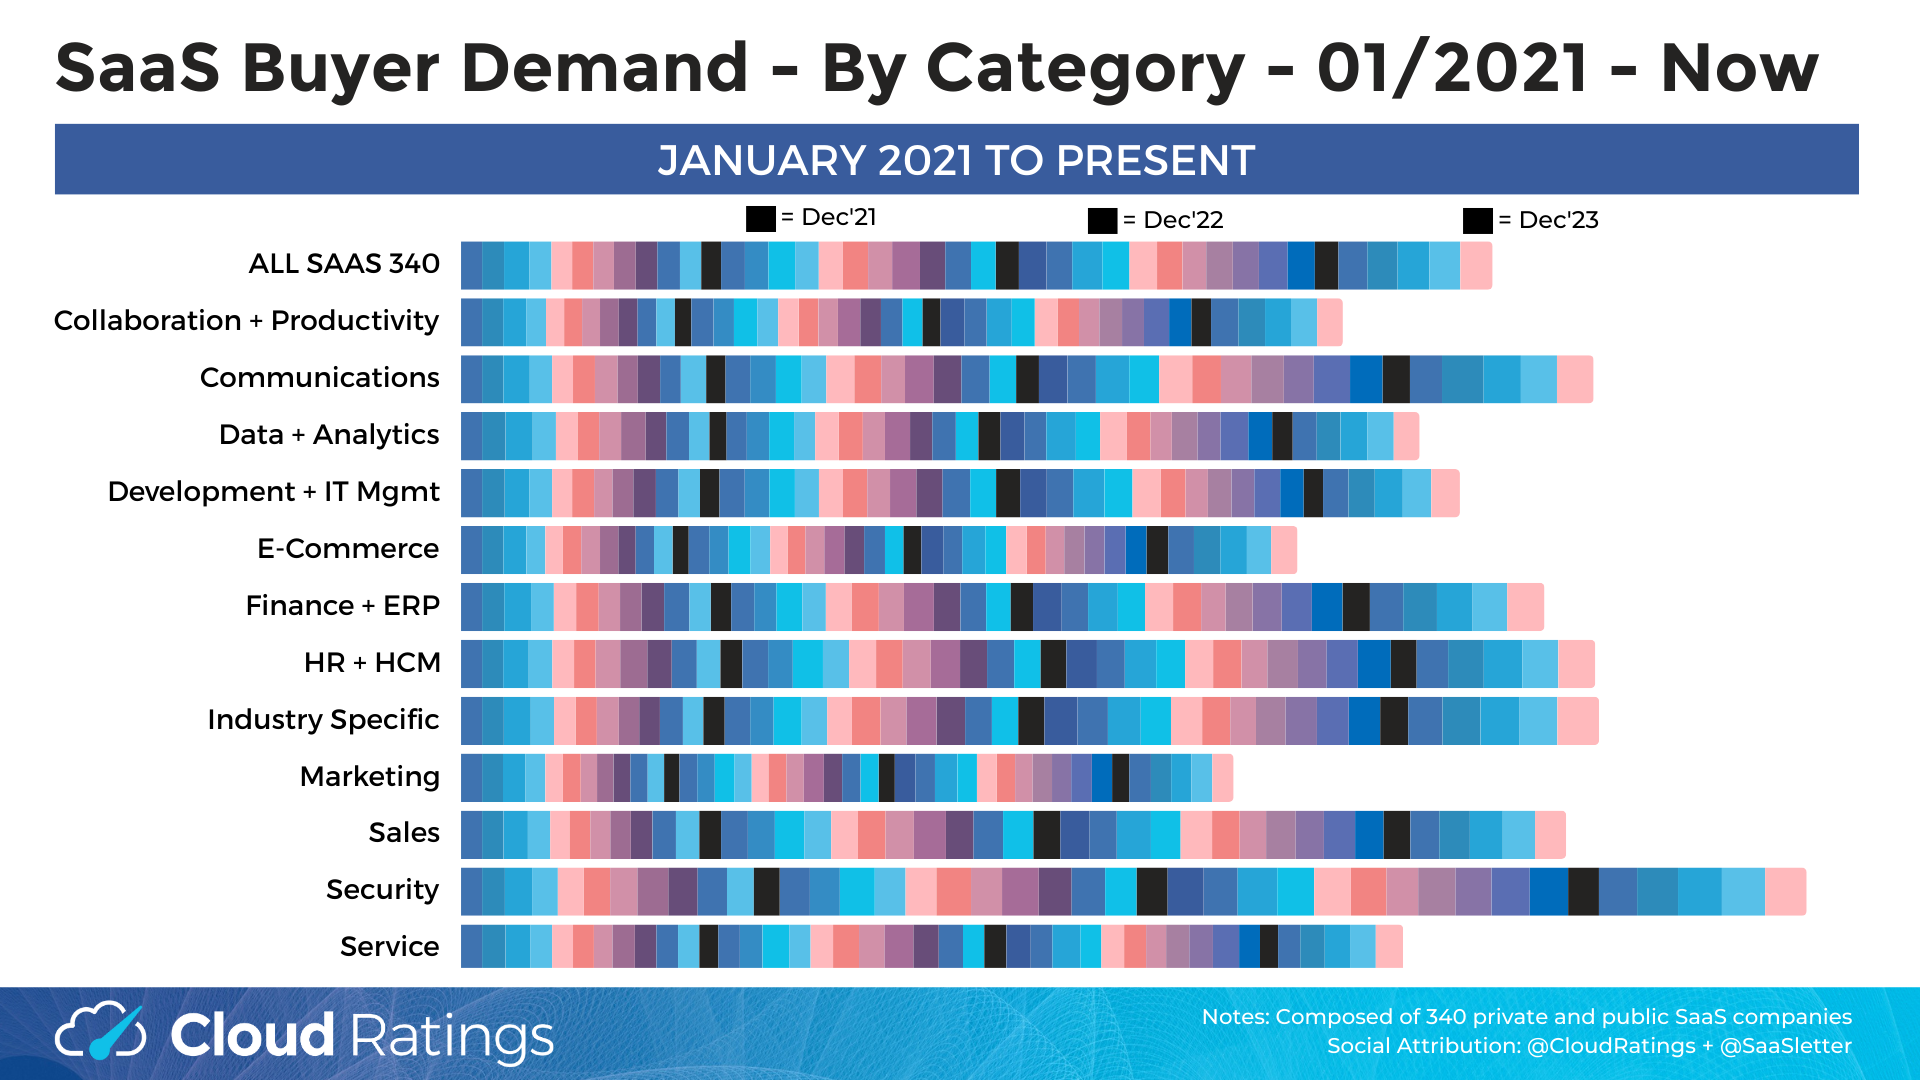
This slide presents growth for the last month and last three months, respectively:

Callouts from recent trends:
Above Average Performers: Consistent with prior months, the strong performers were Security, Communications (still attributable to MessageBird’s price cut), Industry Specific / Vertical, HR + HCM, and Finance + ERP (see our earlier “Office Of The CFO Software Surge” note enhanced with G2 adoption data).
All of the category drill-downs - like this Industry Specific / Vertical example - are available in this slide PDF:
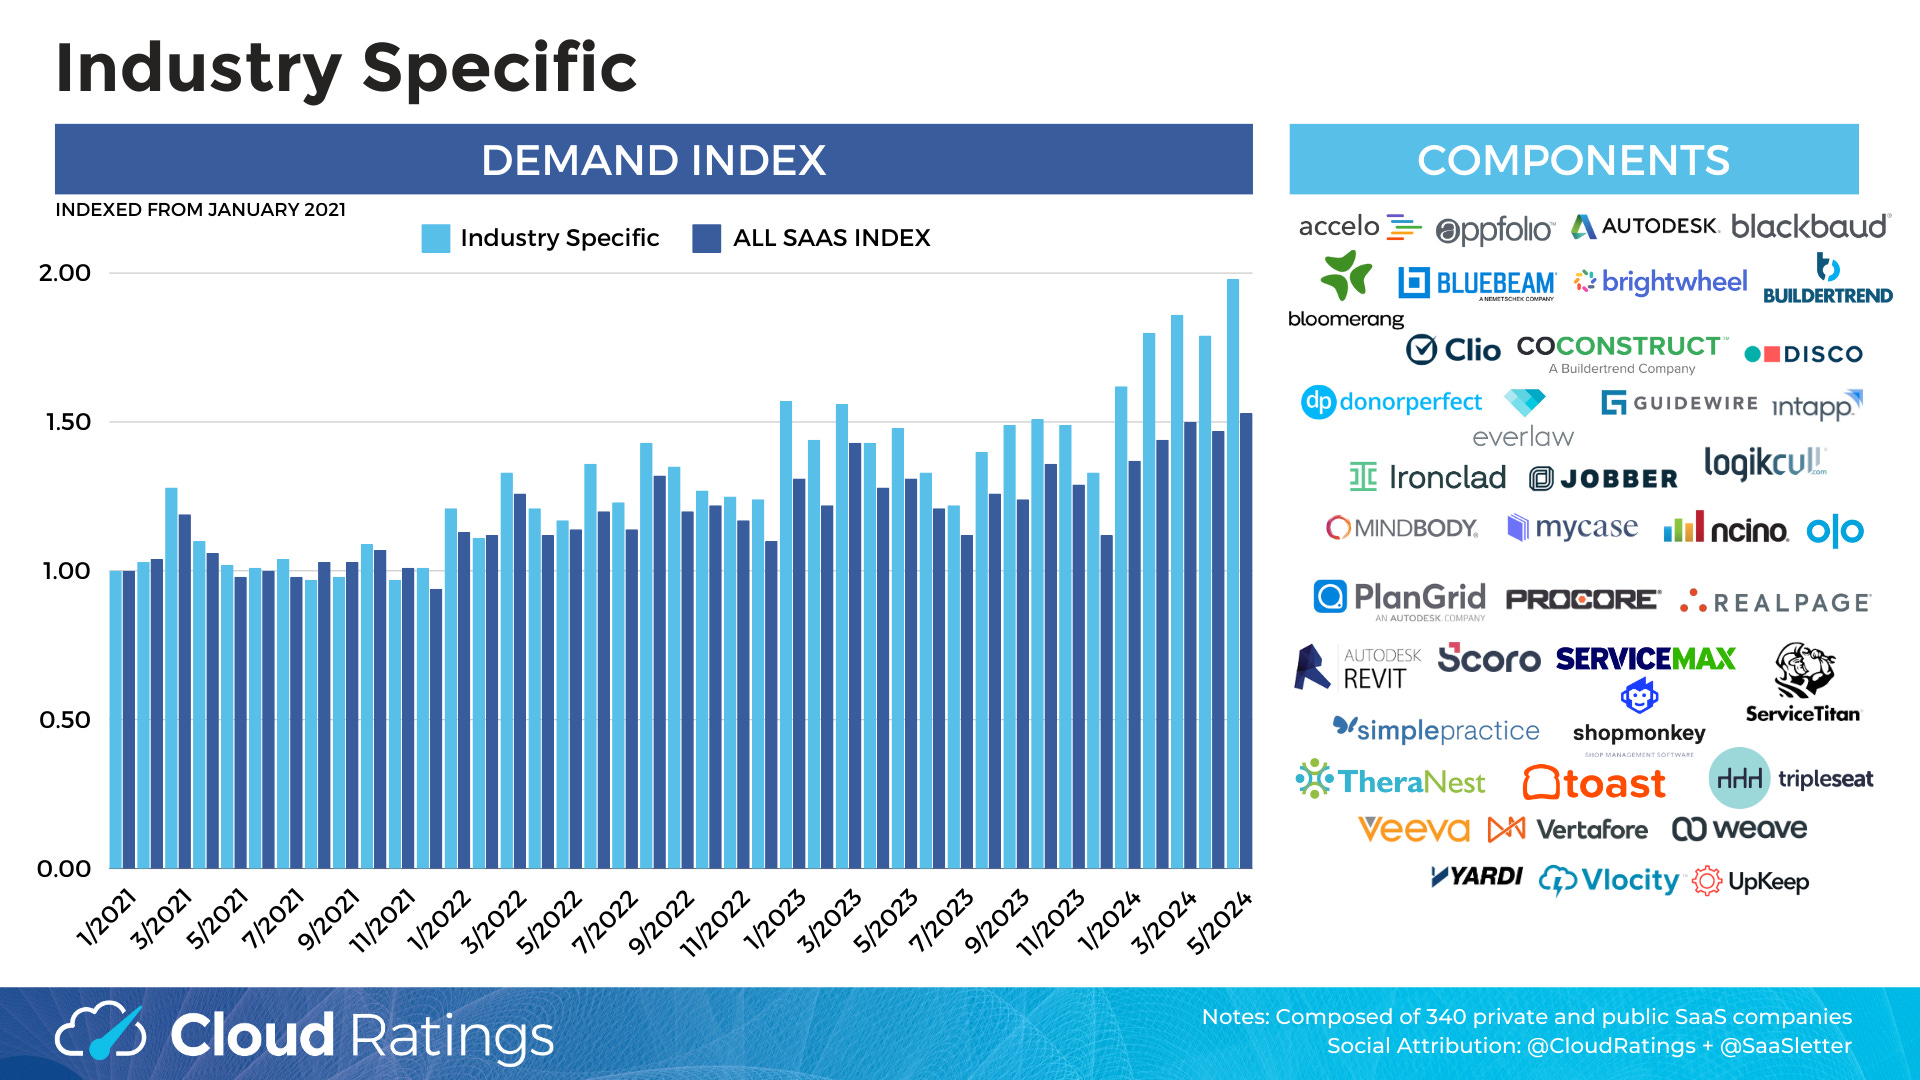
Top Performing Industry-Specific Vendors (Past 3 Months Trend): Ironclad, MyCase, Jobber, Guidewire, RealPage, Intapp, Shopmonkey, ServiceMax, Logikcull, Accelo, Tripleseat, Scoro, and Everlaw. Clearly, legal is a hot vertical.
Other Trends
By customer mix, Enterprise vs SMB remains up and down with no notable pattern:

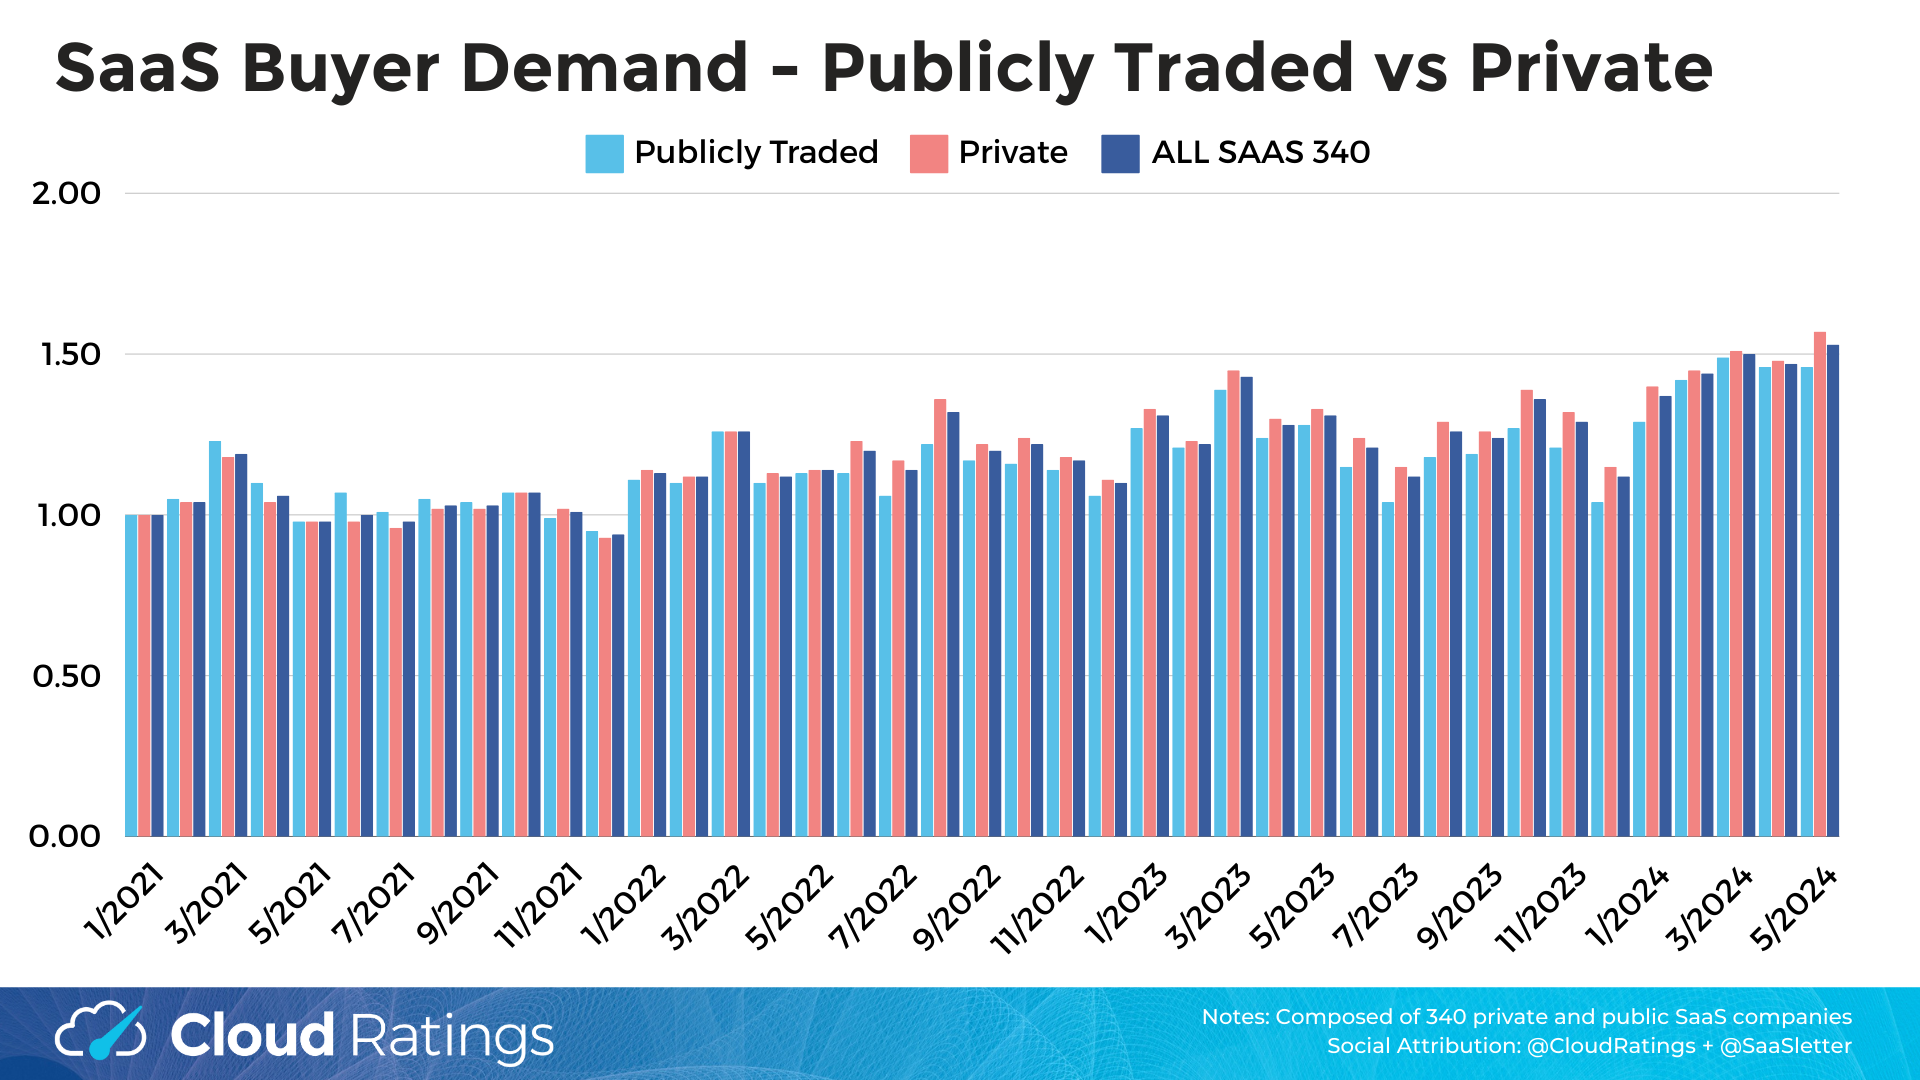
Generally, private companies have outgrown publicly traded SaaS the last 12 months:
May SaaS Employment Index

As a reminder, our SaaS Employment Index covers employment trends for 3,500+ private US HQ’ed software companies. Slides for this month are available here:
Given significant investor interest in this series for their ZoomInfo diligence, we offer granular coverage for the sales function - examples here:


Curated Content
“InfraRed Report” - Redpoint released its annual 56-slide review of infrastructure software - my InfraRed 2024 excerpts here
“I don't know where value capture is going to happen in AI - Do you?” - Patrick Mathieson from Toba Capital
“The Future Of Application Software” - Akash Bajwa from EarlyBird VC and our earlier AI-investing podcast guest
Gartner’s latest AI Hype Cycle
Thanks to David Dulany, Founder + CEO of Tenbound, for having me on their podcast:
*To publish closest to month end, we are accessing the underlying API data “early” (relative to the typical SEO and PPC users that do not require such immediacy). Therefore data should be considered “provisional” (i.e. subject to revision by our data provider) and create volatility in the data presented in the 2 most recent months.
**Demand Index vs Gartner SaaS Revenue possible “apples versus oranges” dynamics:
potential buying journey shifts away from Google search and now starting on review platforms (like G2) and - to a lesser extent in terms of measurable impact - community recommendations (like private executive Slack groups).
a general trend for Google search volumes to plateau with scale. We’ve also observed this dynamic with retailers.
most importantly, the SaaS Demand Index is a *forward indicator*, whereas Gartner’s market sizing and growth capture *realized revenue* → given sales cycles, “lagging” our SaaS Demand Index is the right way to examine correlation.
This report was first published on cloudratings.com.
Depending on data volume, could be interesting to distribute this data set on the snowflake marketplace for investment firms