
Warning: We are doing more thematic, top-down, long-horizon thinking on AI. Like this note, using broad OpenAI data below.
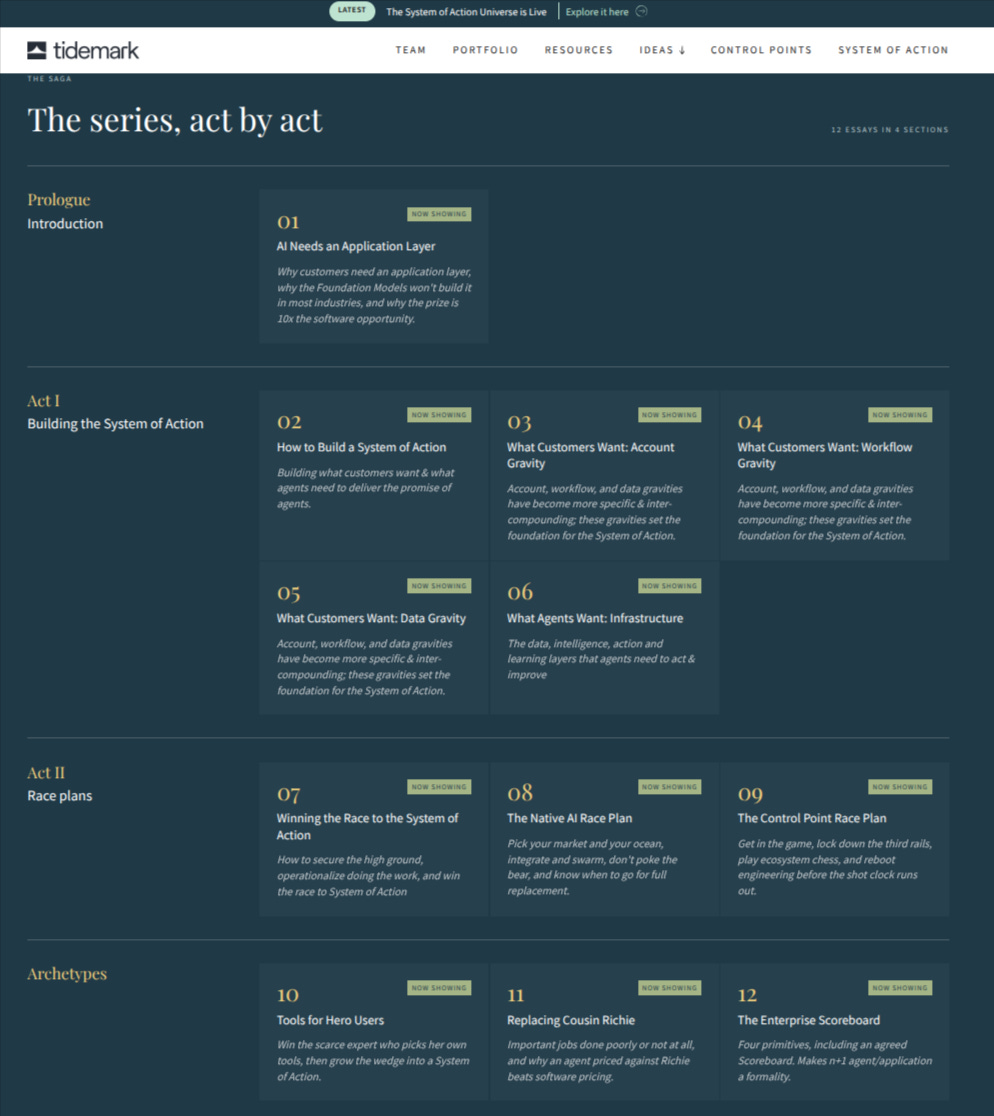
This top-down work can help us analysts understand “from the front lines” strategic/tactical content like Tidemark’s recently debuted “System of Action” (a 12-essay playbook) from Dave Yuan + team:
OpenAI’s “Expanding World of Work” - October 2026
OpenAI Economic Research recently released its “ChatGPT’s Expanding World of Work” report + the underlying OpenAI Signals v3.0 dataset - our business-filtered data computations, charts + software investor takes below.
1. Methodology: Isolating the B2B From Consumer
Two methodology caveats upfront (1M messages/mo, July '24–Sept '26; mapped to 165 O*NET Intermediate Work Activities across ~100 countries):
No Enterprise / API / Codex Traffic: Tracks individual ChatGPT plans only, so excluding ChatGPT Enterprise, Team/Business, API volume + Codex. Material omission for software investors
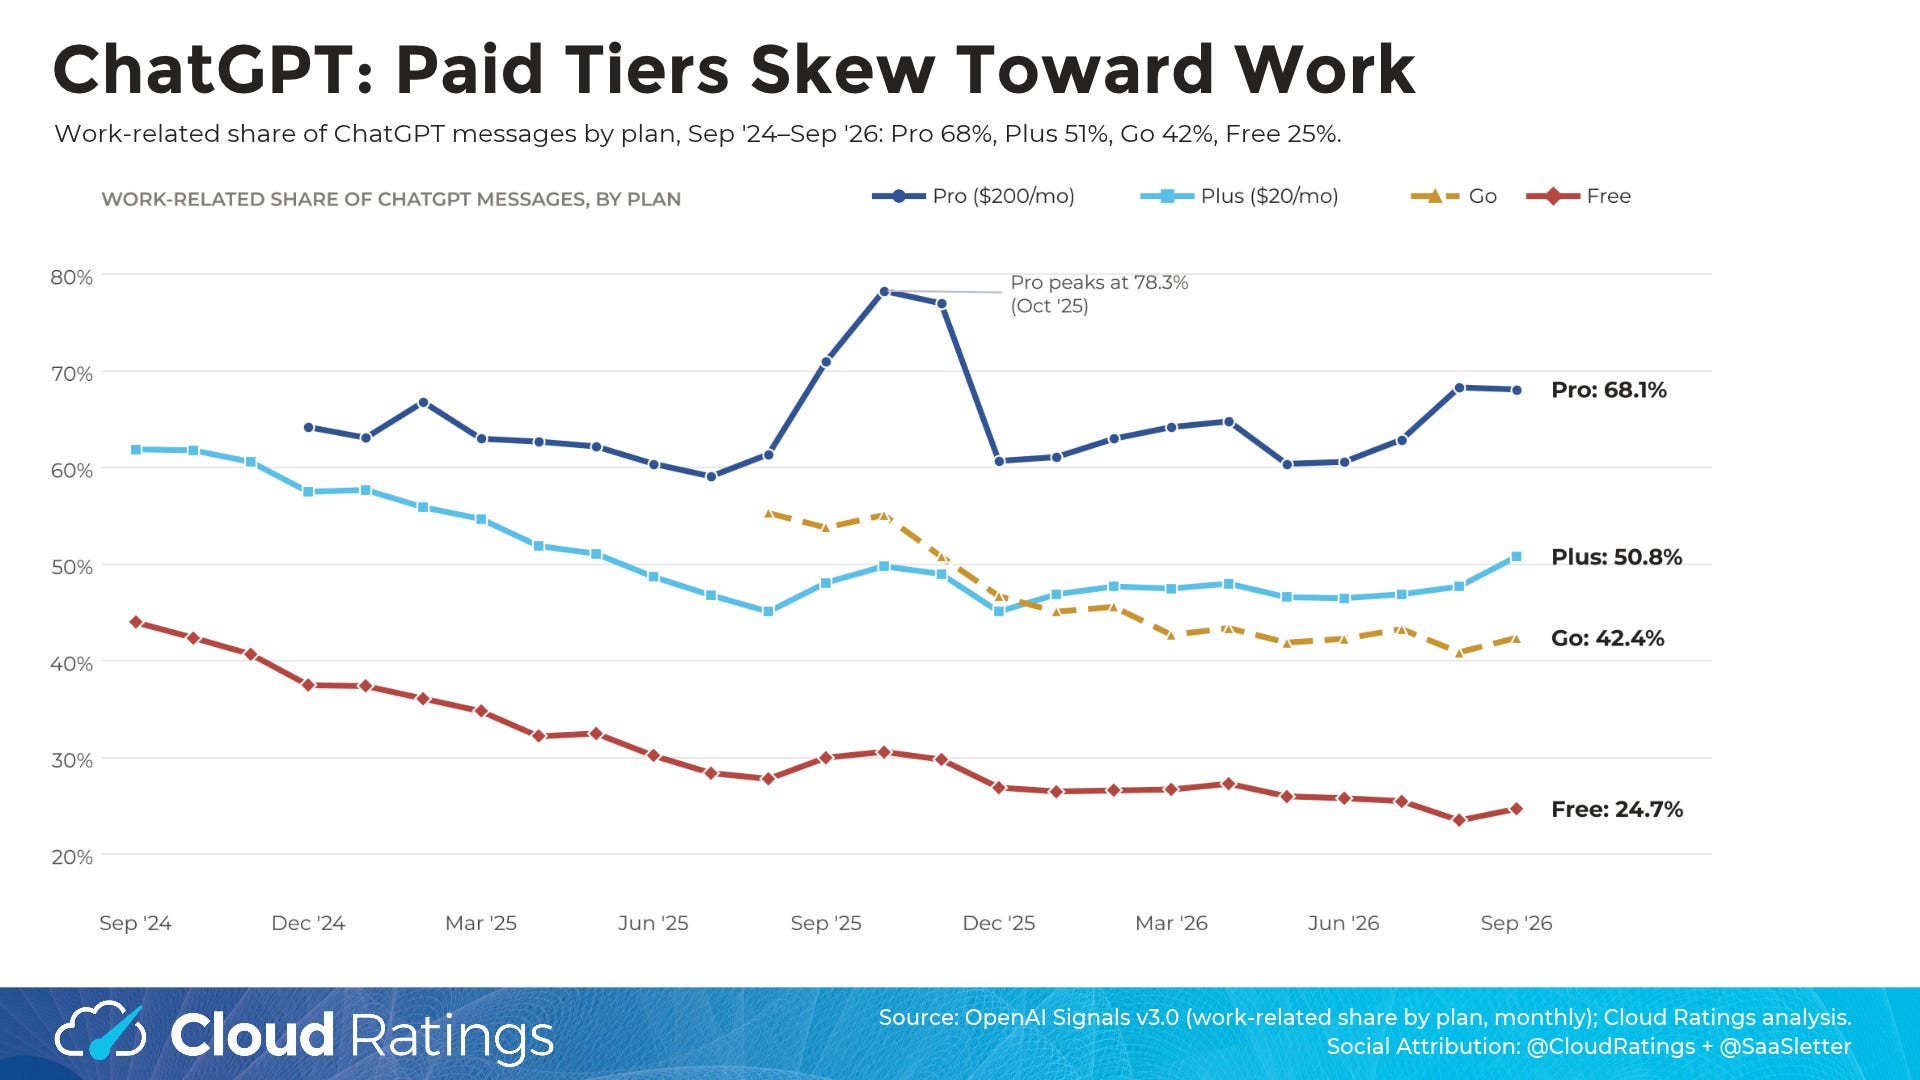
Massive Plan-Tier Stratification: Casual consumer + student adoption dragged Free tier work share from 44.0% (Sep '24) to 24.7% (Sep '26), whereas 68.1% of ChatGPT Pro ($200/mo) messages are professional work (Plus at 50.8%, Go at 42.4%).
Note: All charts below filter strictly on 100% work-related US messages.
2. “Workflow Graduation”
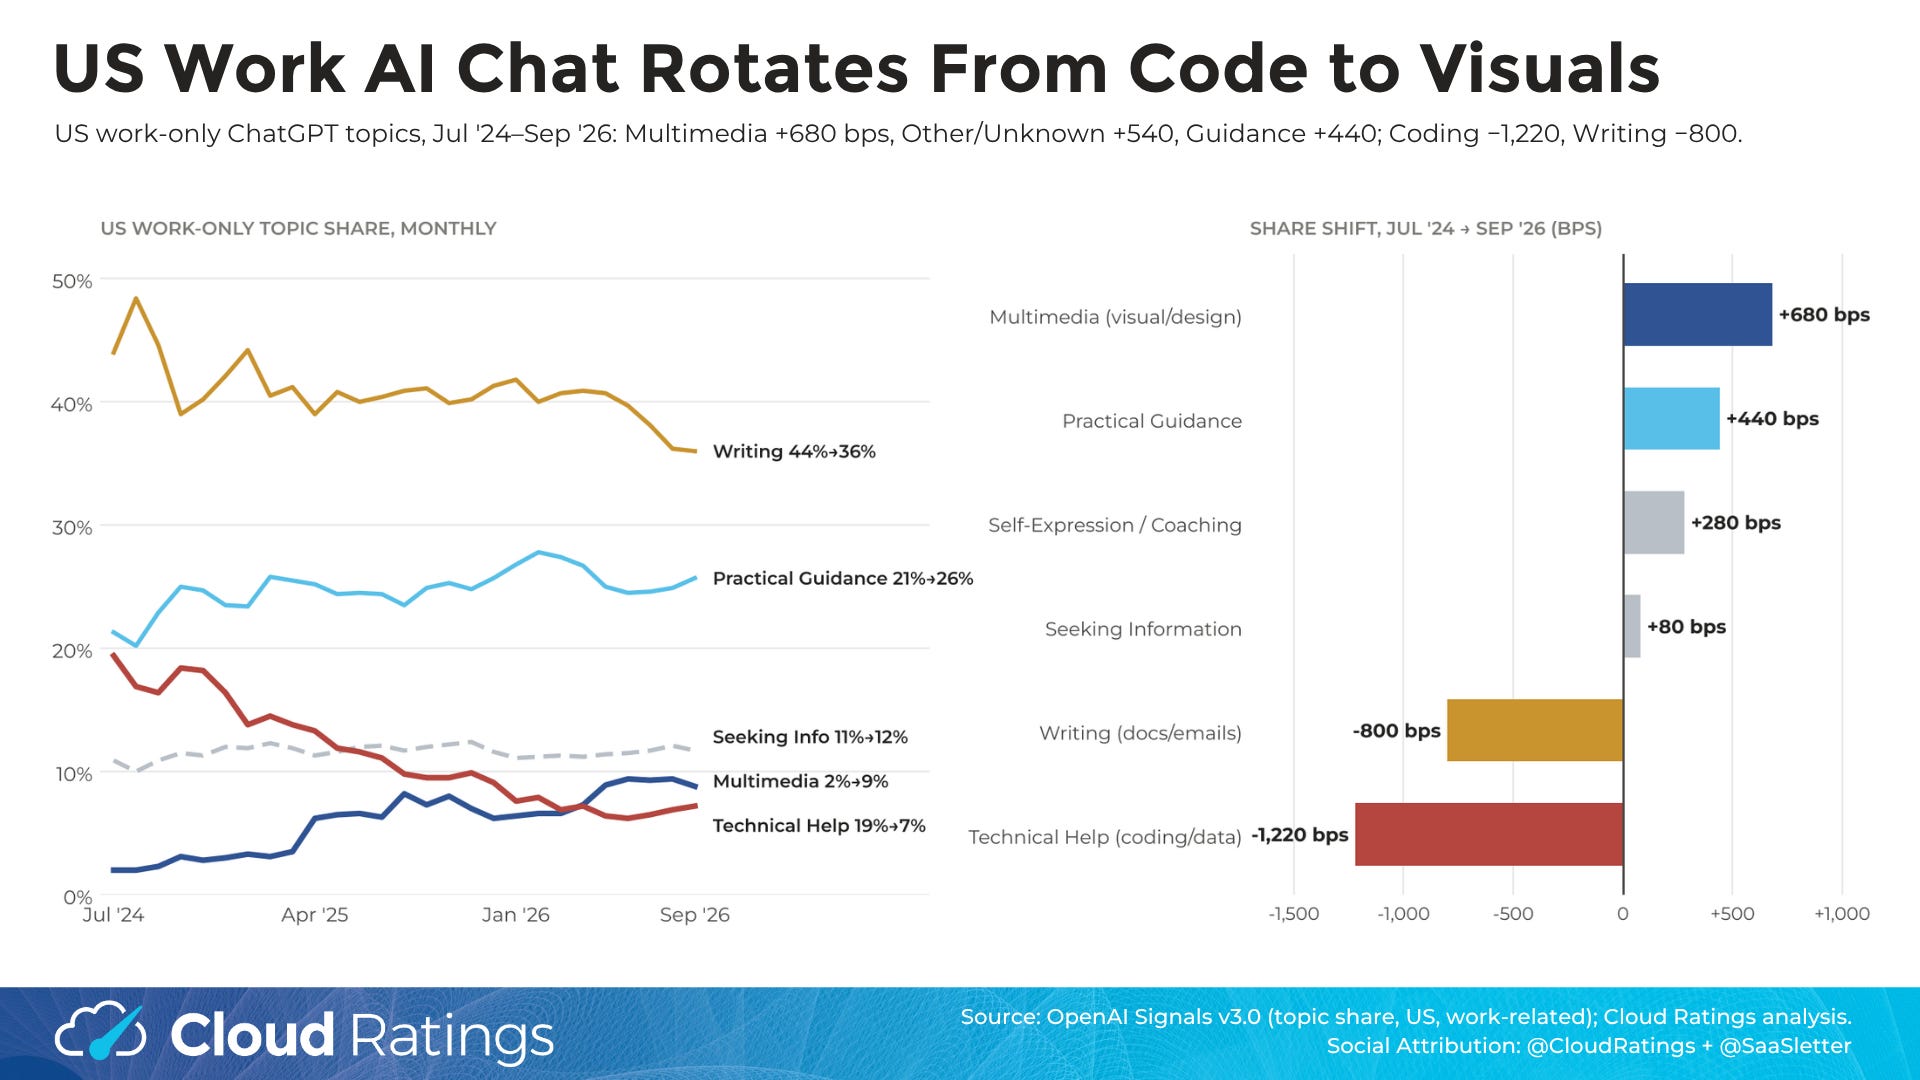
Callouts from isolating US work-related messages across topic categories (Jul ‘24 to Sep ‘26):
The Rotation: Technical Help (coding, data analysis, math) fell -1,220 bps (19.4% → 7.2%, a -63% relative drop) and Writing fell -800 bps (44.0% → 36.0%), while Multimedia (+680 bps), Other/Unknown (+540 bps) + Practical Guidance (+440 bps) gained share.
"Doing" vs. "Expressing": Direct task execution (Doing) moved from 53.4% to 42.2% (-1,120 bps), while conversational reflection/coaching (Expressing) jumped from 8.9% to 26.7% (+1,780 bps).
Our Take = The "Browser = R&D Incubator" Thesis: A -63% drop in browser-based Technical Help doesn't mean engineers + analysts cut AI usage by 63%. Because this dataset excludes Enterprise, API + Codex, the -1,220 bps drop reflects "Workflow Graduation" - commercial coding + data analysis graduating out of copy-paste browser tabs into IDE-native agents (Cursor, Claude Code, Codex) and embedded SaaS.
3. AI vs. The Real U.S. Economy = More Planning, Less Execution
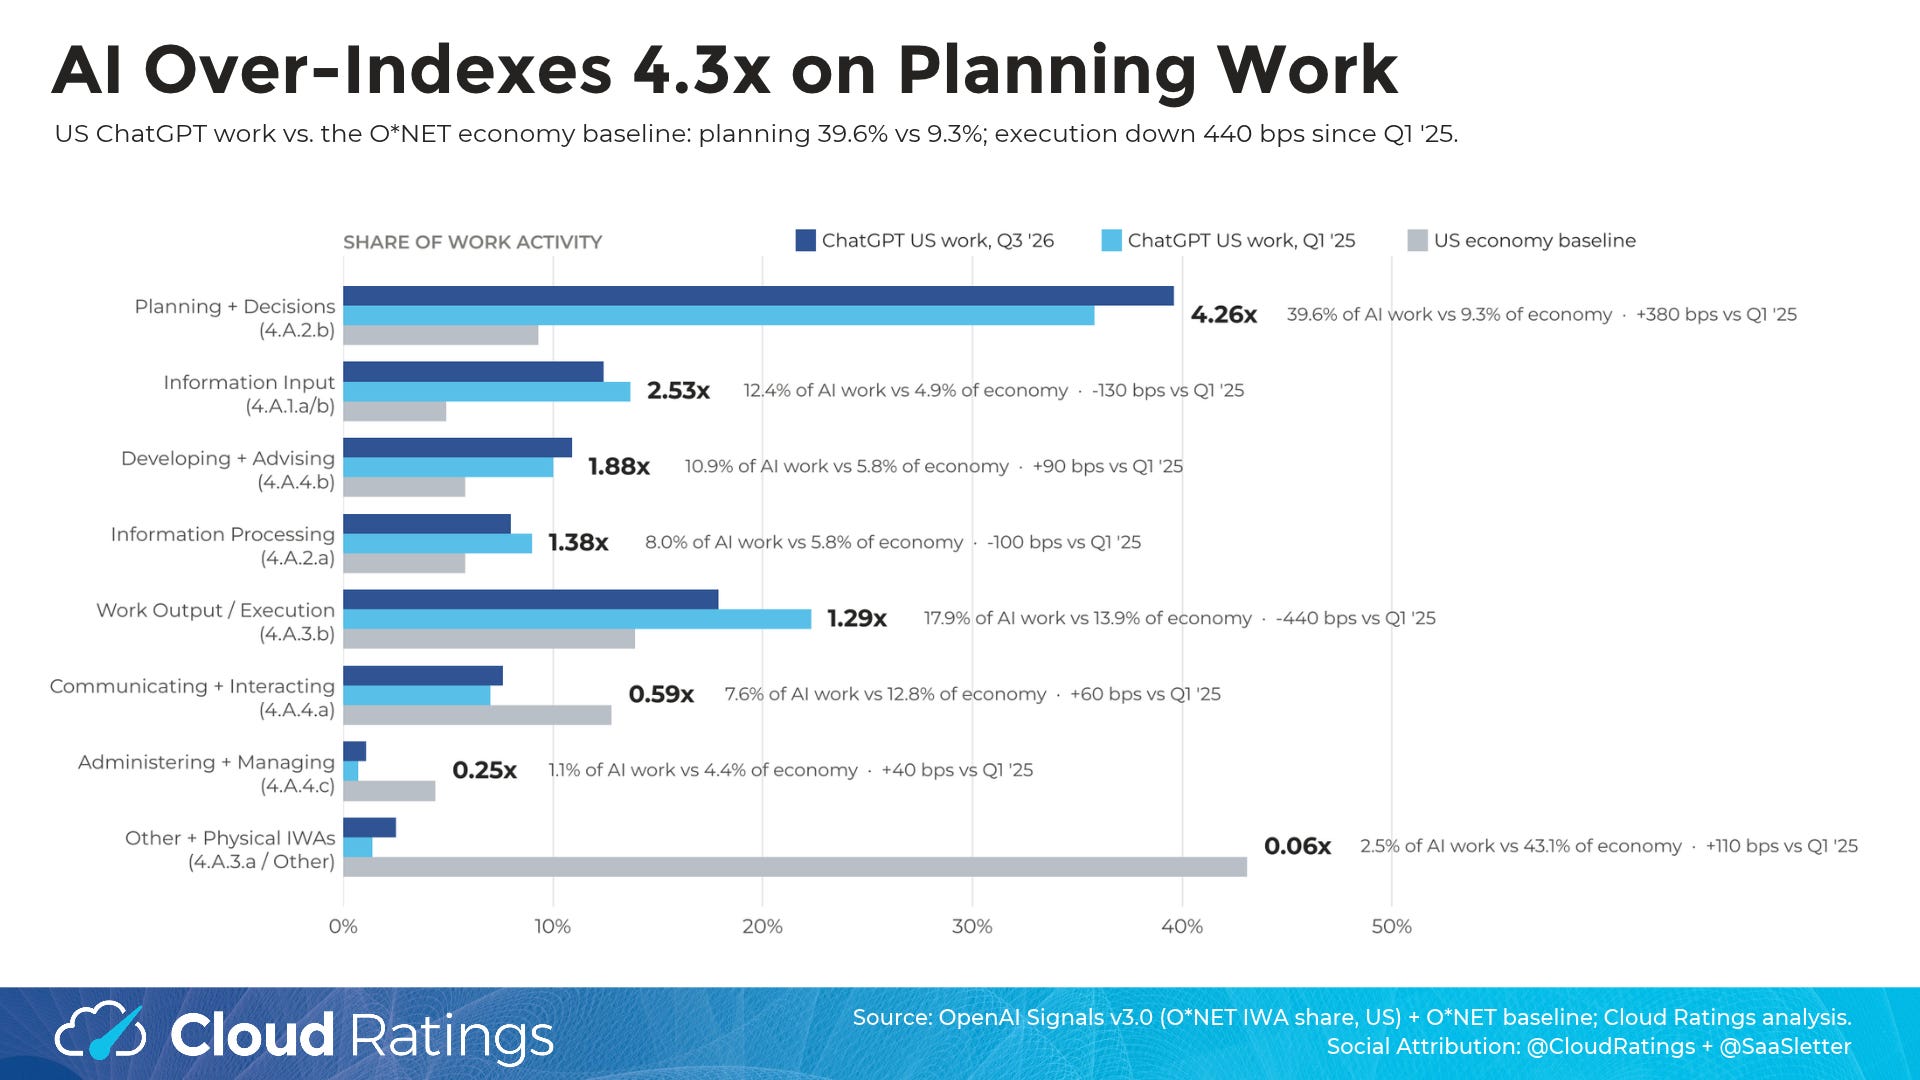
US ChatGPT work prompts vs. OpenAI's employment-weighted O*NET economy baseline:
Massive Over-Index on Pre-Execution (Planning + Decisions at 4.26x): Planning + Decisions expanded +380 bps from 35.8% in Q1 ‘25 to 39.6% in Q3 ‘26 → 4.26x its 9.3% share of the real U.S. economy.
Execution Compressing (1.29x): Work Output / Execution contracted -440 bps from 22.3% (Q1 '25) to 17.9% (Q3 '26), compressing its over-index ratio from 1.60x to 1.29x.
The “System of Record” Moat (0.25x-0.59x): ChatGPT under-indexes the economy in Communicating + Interacting (0.59x; 7.6% vs. 12.8%) and Administering + Managing (0.25x; 1.1% vs. 4.4%).
~Key message here: Single-player chat struggles with multi-party workflows, back-office compliance + physical operations (0.06x vs. 43.1% of economy) - where deterministic B2B SaaS systems of record hold their moat.
4. Granular B2B Workflows: Vertical AI + Buyer Research Break Out
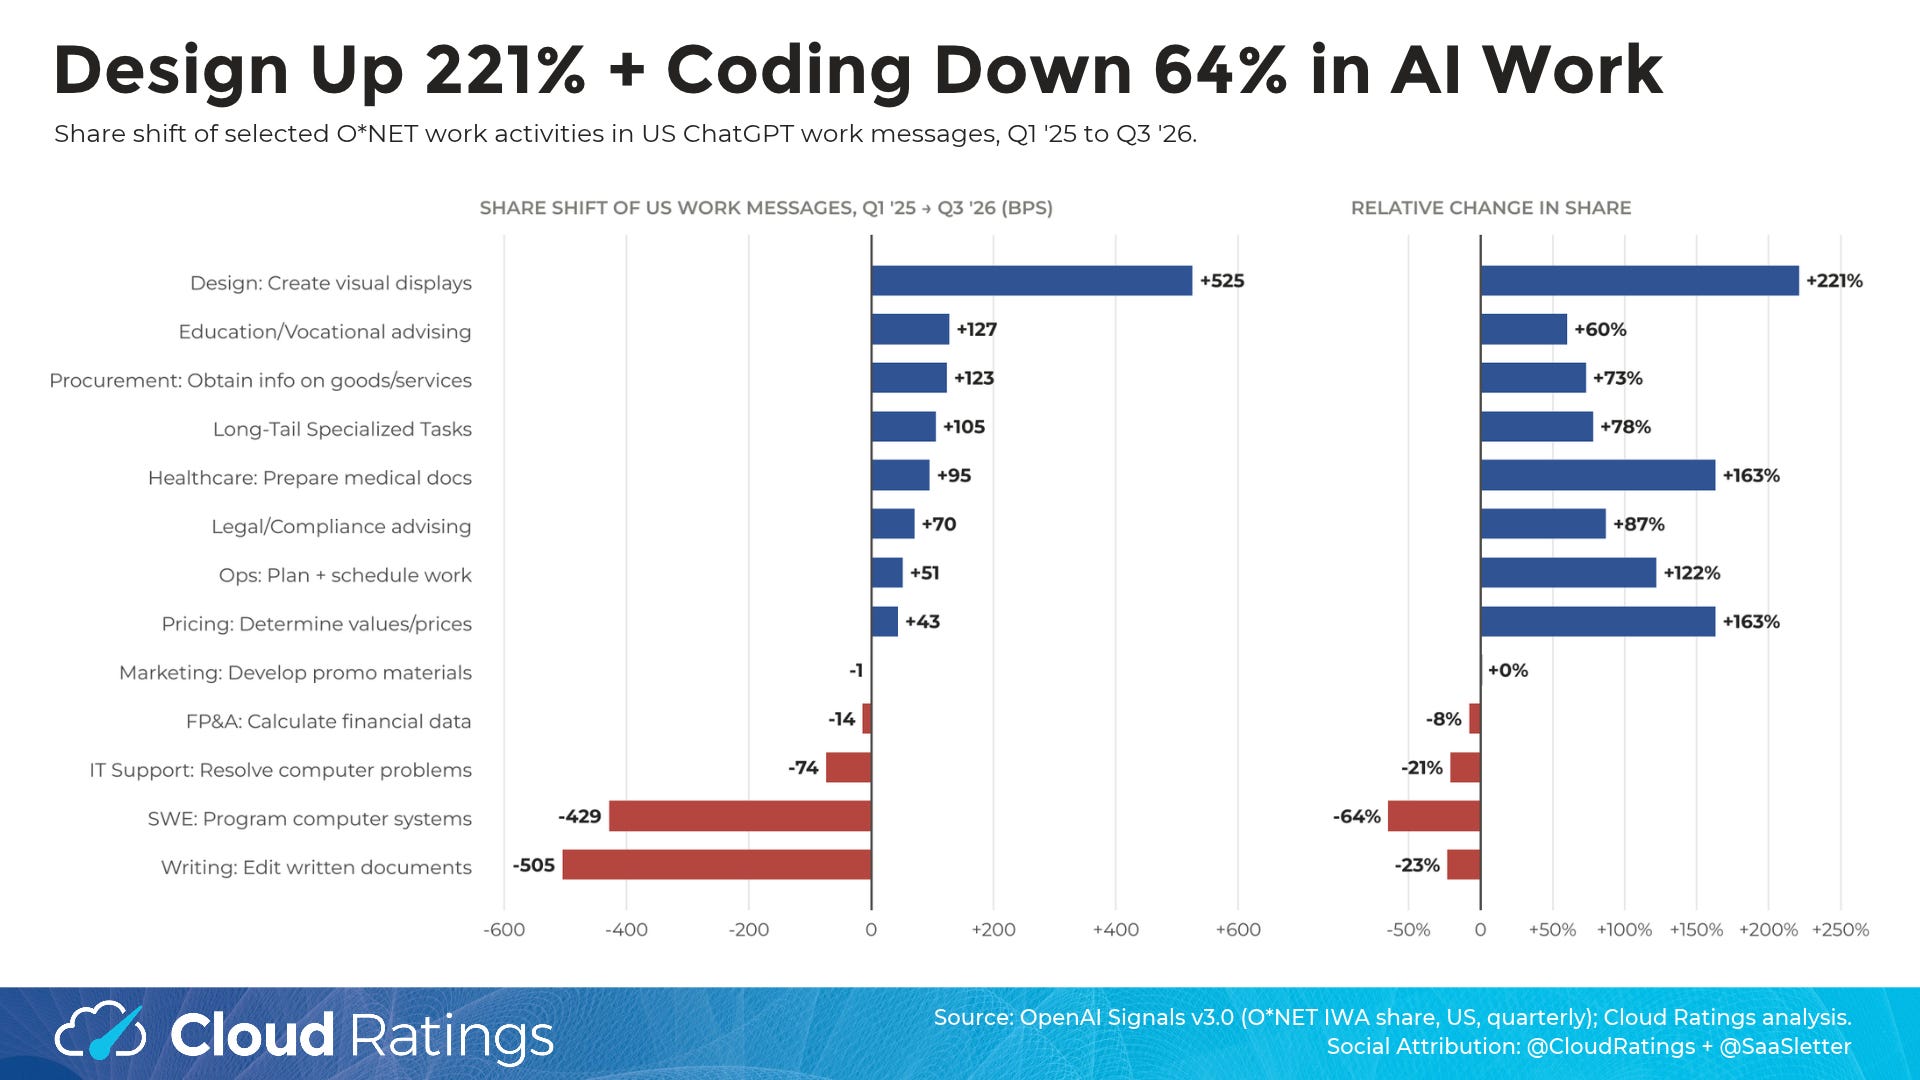
O*NET Intermediate Work Activity shifts (Q1 '25 to Q3 '26):
Multimodal Design Is the #1 Breakout (+525 bps / +221%): “Create visual designs or displays” jumped from 2.38% to 7.63% of all US work messages to become the #2 overall business activity in the dataset → a direct competitive headwind for low-end creative/design SaaS seats (+ aligns with Canva’s very recent “restructuring” of 22% of staff)
B2B Procurement + Pricing Research (+73% to +163%): “Obtain information about goods or services” climbed +123 bps (+73% relative, to 2.92% of all US work prompts) and “Determine values or prices of goods/services” grew +163% (to 0.69%). Combined with technology evaluation (1.41%), ~5.0% of all US professional ChatGPT usage is now vendor discovery, product research + pricing benchmarking.
Vertical / Regulated Pull (Healthcare +163%, Legal +87%): Even on non-enterprise plans, “Prepare health or medical documents” (+95 bps / +163% to 1.53%) and “Advise on legal or regulatory matters” (+70 bps / +87% to 1.50%) are compounding rapidly, while horizontal “Program computer systems” fell -429 bps (-64%).
As always, do your own work and go read the full OpenAI Signals v3.0 report.
And maybe go read Tidemark’s “System of Action” given the thematic overlap.
“Crossing The Agentic Chasm” - Tim Sanders - G2
SPOTIFY | APPLE | OTHER PODCAST PLATFORMS| VIDEO
We wanted to flag our new deep-dive episode with Tim Sanders, G2's Chief Innovation Officer (his second appearance after May’s “The AI Answer”).
About Cloud Ratings
In mid-2024, we announced a research partnership with G2 - more here:

with this slide showing how our G2-enhanced Quadrants (like our recent Sales Compensation Software) release, this business of software newsletter you are reading, our podcasts, and our True ROI practice area all fit within our modern analyst firm:
