
SaaSletter - Climbing The ACV Mountain
Plus The November 2024 Cloud Ratings SaaS Demand Index

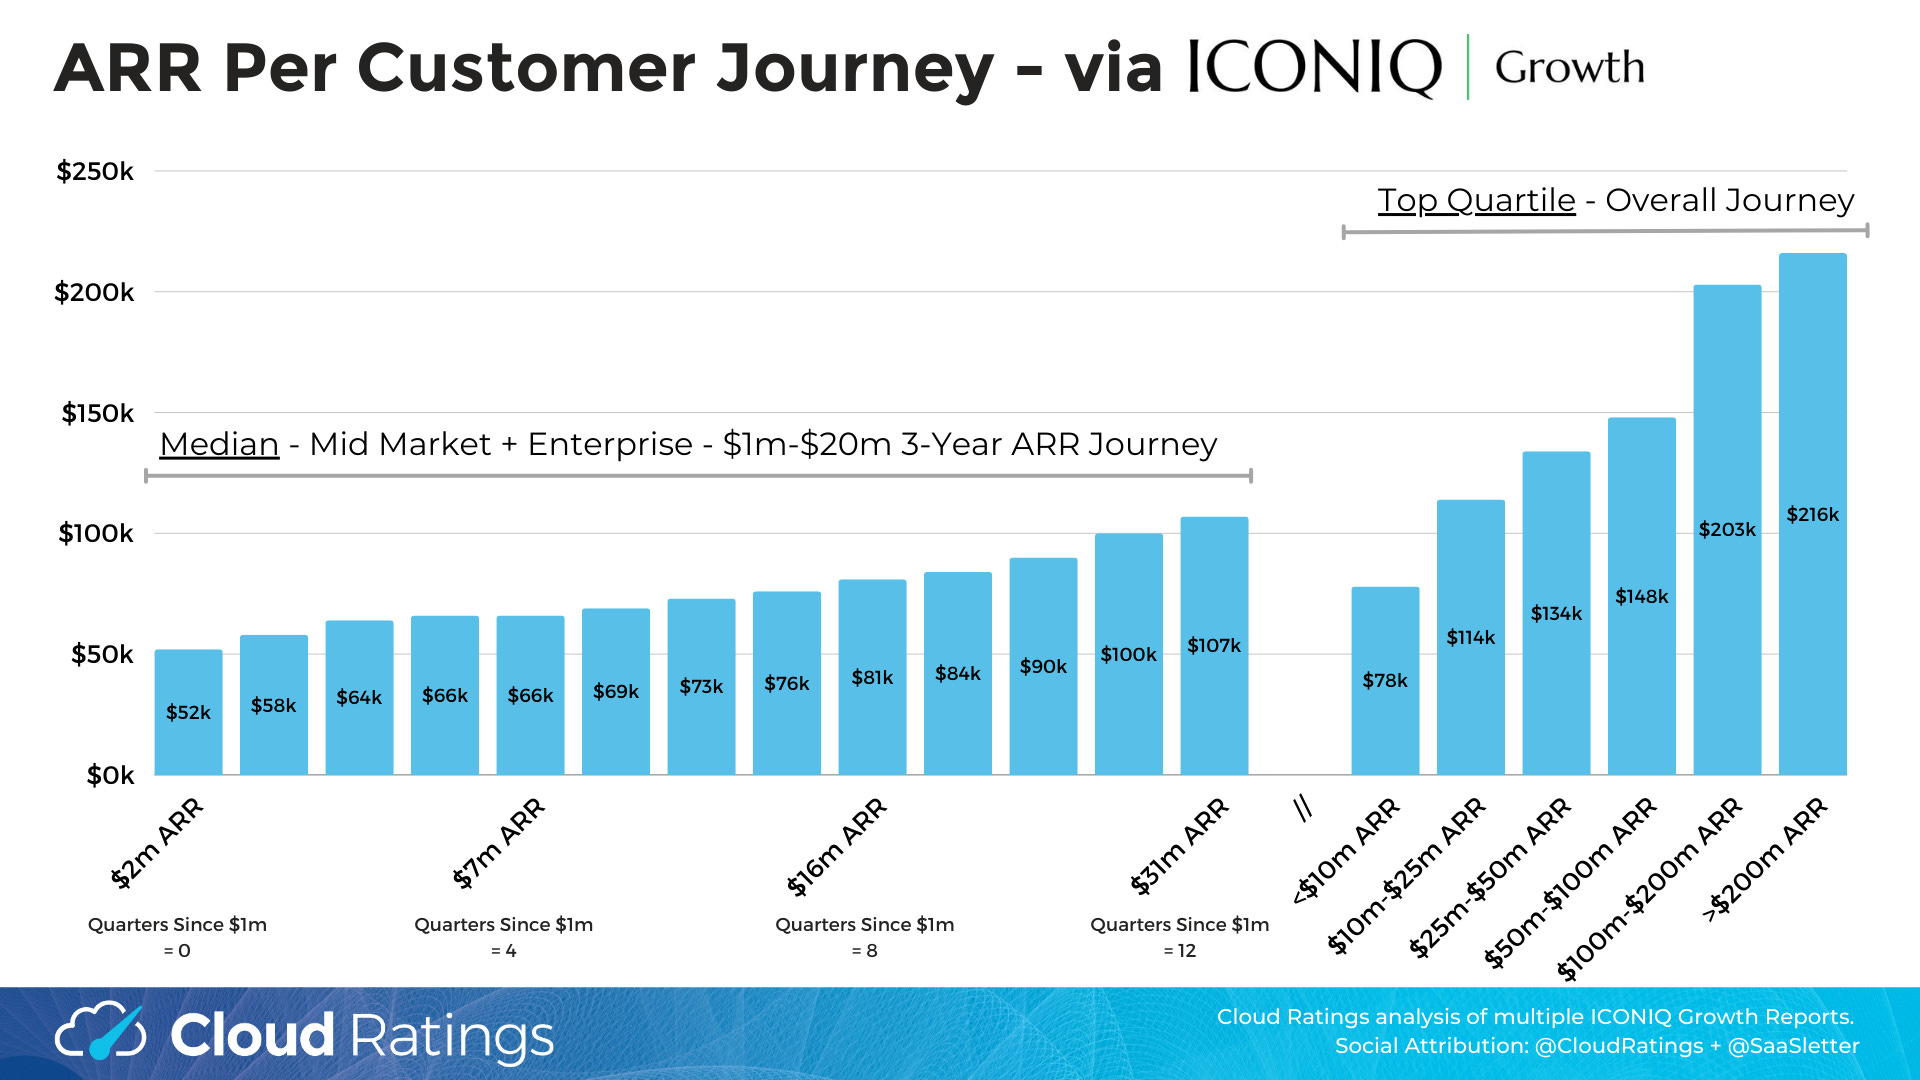
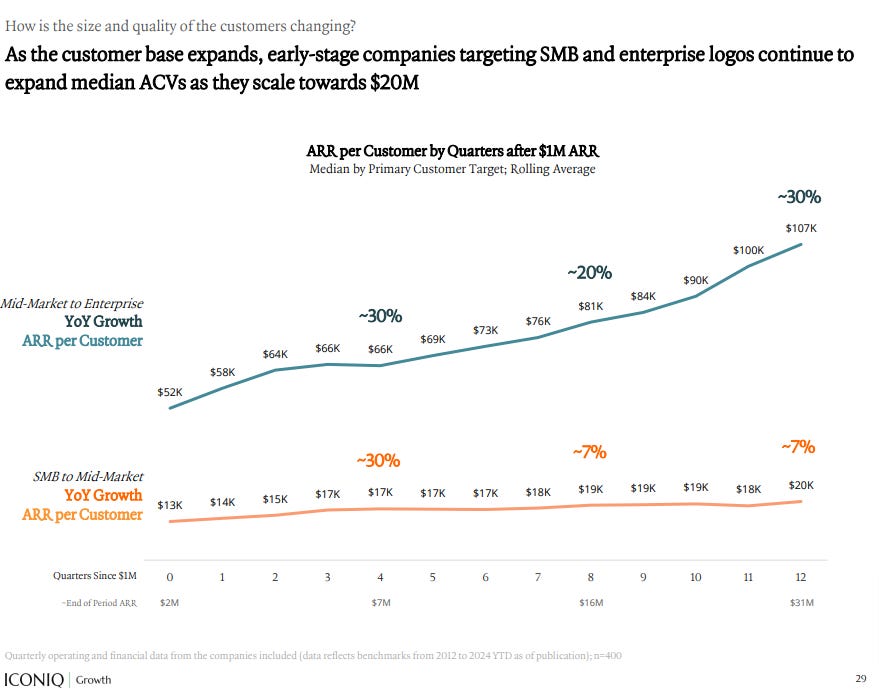
ICONIQ Growth: ARR Per Customer
Weaving together reports from ICONIQ Growth, we summarized the ARR per customer at various ARR thresholds:
Why does this matter?
Operators + investors can work backward from scaled ACVs when setting earlier pricing, product, and general strategy decisions.
Notably, in consultations for our Cloud Ratings True ROI practice (essentially 3rd party ROI reports validating your software business case; a Forrester “Total Economic Impact” (TEI) alternative)…
Early-stage founders - especially in AI - are often looking for a roadmap on pricing and product.
This ICONIQ Growth data is invaluable.
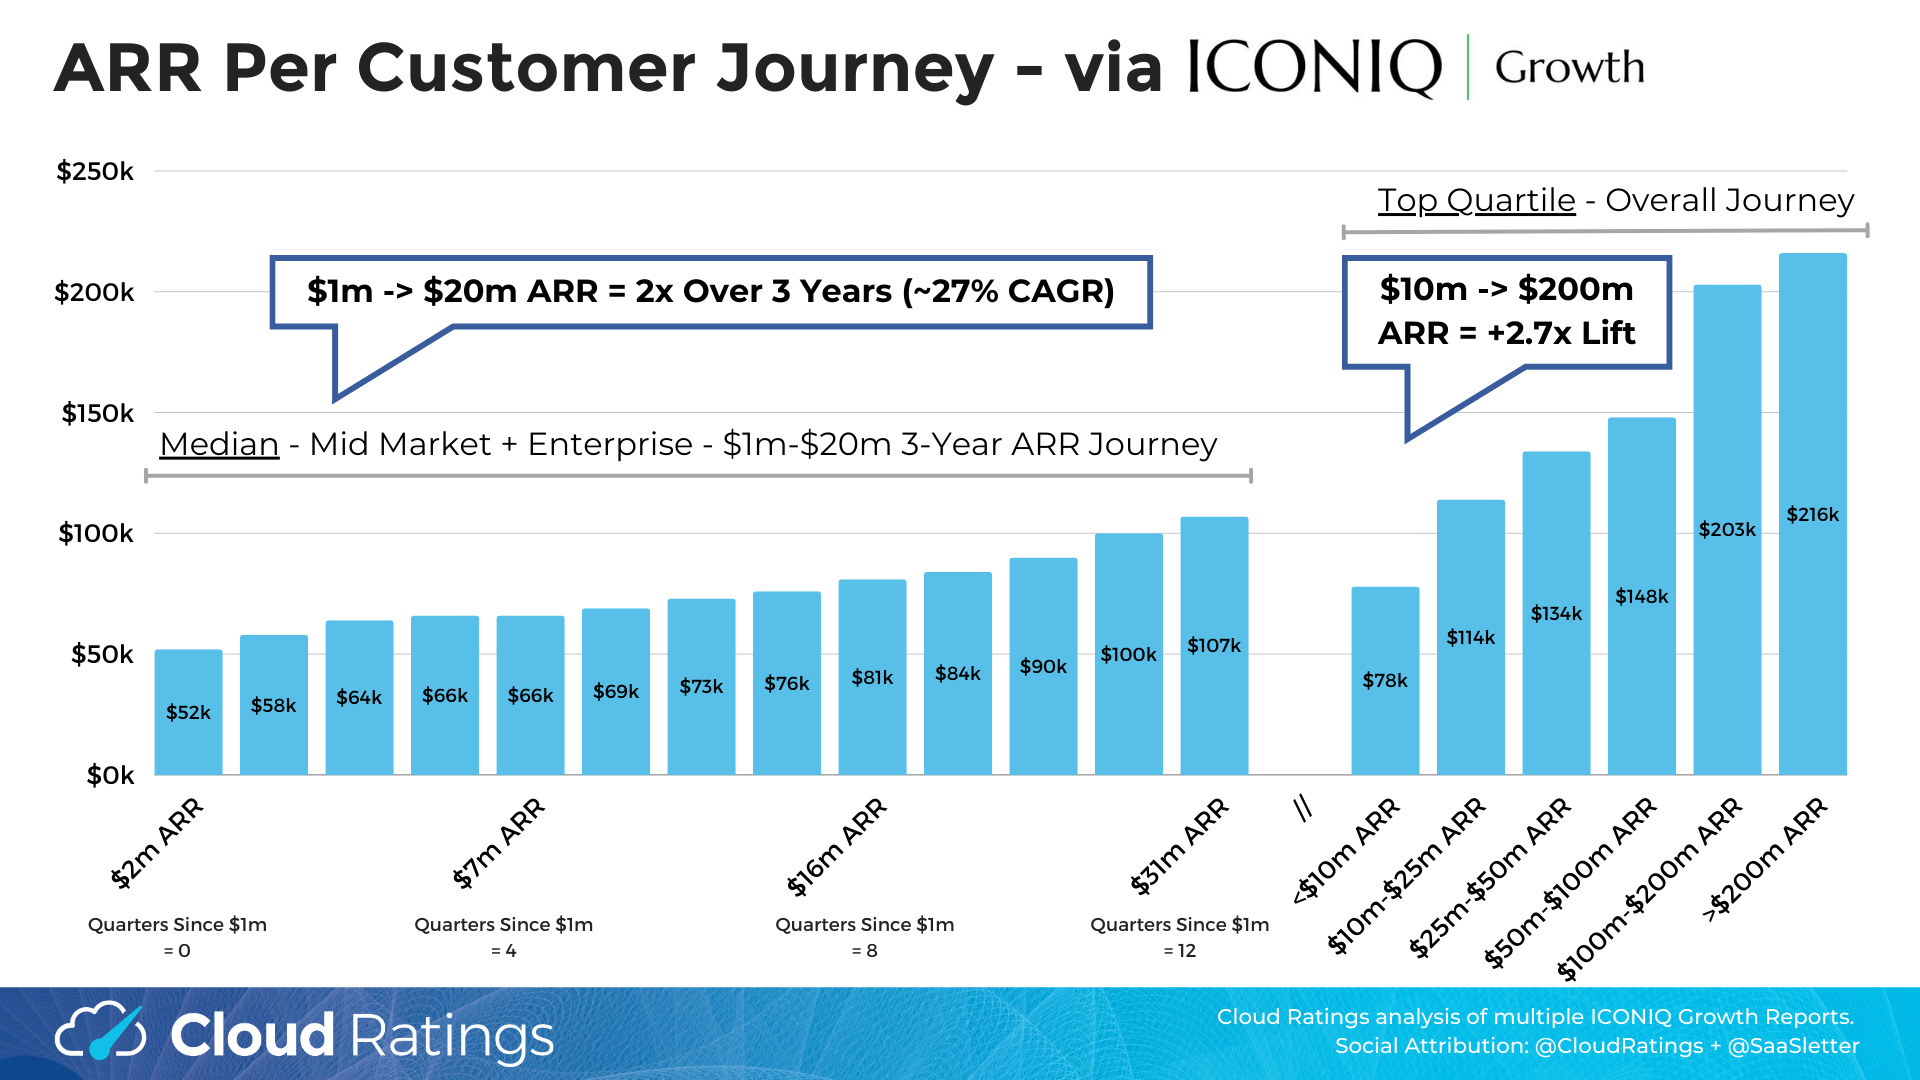
ARR per customer doubles over the $1m→$20m ARR journey ($52k at $2m ARR→ $107k at $31m ARR). (Only sample = median)
Given a 3-year period, this represents a 27% CAGR in ARR per customer. 27% is a high bar to clear (i.e., well above a “10% seats/products + 5% price = 15%” growth algorithm)
Over the longer $10m → $200m ARR journey, ARR per customer increases by 2.7x ($78k → $216k per customer) (Only sample = top quartile)
Further implications:

Multi-Product Strategy Early To Achieve Higher ACV: As Jason Lemkin has covered (slides + video) in his “The Bar Has Gone Up in SaaS. The Era of HyperFunctional SaaS is Here” thesis, “Multiproduct is now the norm. Gotta start much earlier.”
Sales Talent Composition: Knowing you have to go from $52k→$107k ACV on the $1m→$20m ARR journey *might* impact decisions on sales talent - whether VPs of Sales or Account Executives - since each ACV threshold is different and generally more challenging. With similar dynamics applicable to Customer Success and Marketing. And even Product.
Initial Price Points: If a founder sets too low of an initial price point, “anchoring low” might derail the journey: It is very hard to increase prices in magnitude AND quickly enough to meet these ARR per customer benchmarks.
For further context, here is the ARR per customer data relative to publicly traded companies (via Meritech’s software comparables site):

November 2024 Demand Index
We’re excited to update the SaaS Demand Index with data through November 2024.
Due to an ongoing, partial shift in Google’s methodology, this month’s sample consists of 54 companies (versus our usual 340) covering 100,000+ high-intent searches. However, all graphs and metrics are pro forma on a historical basis (i.e., apples to apples).

High-intent search volumes were up +24% year-over-year and up 6% month-over-month. Given ongoing Google methodology changes, consider this reading highly provisional with obvious volatility.
Reminder: this is a directional, free, and ever-evolving analysis → always do your own due diligence. Moreover, the data captured here is best characterized as top-of-funnel or dark funnel → factoring in sales cycle length, do NOT use this Demand Index as a predictor of near-term financial results and/or financial guidance.
Curated Content = Newsletter Recommendations
Building on our “Best Software Content Of 2H 2024” edition:

… on an ongoing basis, we will recommend newsletters you might’ve missed.
Recommendations:
Ray Rike’s SaaS Barometer Newsletter here on Substack → SUBSCRIBE
Rob Litterst’s PricingSaaS.com for all things pricing → SUBSCRIBE
The Deal Director for all things sales → SUBSCRIBE
An under-followed sales practitioner newsletter: Andrew Kobylarz’s Hacking Sales Digest → SUBSCRIBE
ICONIQ Growth: Source Reports
The data presented above was sourced from the following ICONIQ Growth reports
“Scaling SaaS from $1 to $20M” - h/t Claire Davis
“Scaling SaaS: Forging Excellence Through Fundamentals” - h/t Claire Davis + Emre Garih.
Notably, this data set includes new logo benchmarks.

About Cloud Ratings
Mid-year 2024, we announced a research partnership with G2 - more here:

with this slide showing how our G2-enhanced Quadrants (like our recent Sales Compensation Software) release, this business of software newsletter you are reading, our podcasts, and our True ROI practice area all fit within our modern analyst firm:
