SaaSletter

SaaSletter

Share this post

SaaSletter
SaaSletter
SaaSletter - R&D Engineering -> Financial Engineering
User's avatar
Discover more from SaaSletter
A chart-heavy cloud + SaaS newsletter
Over 5,000 subscribers
Already have an account? Sign in

SaaSletter - R&D Engineering -> Financial Engineering

Translating ICONIQ's R&D benchmarks into steady state cash flow

Matt Harney's avatar
Matt Harney
Feb 22, 2023
2

Share this post

SaaSletter
SaaSletter
SaaSletter - R&D Engineering -> Financial Engineering
Share

ICONIQ R&D Benchmark’s

My financially-oriented highlights of their “Engineering in a Hybrid World” 35 slide deck from October 2022.

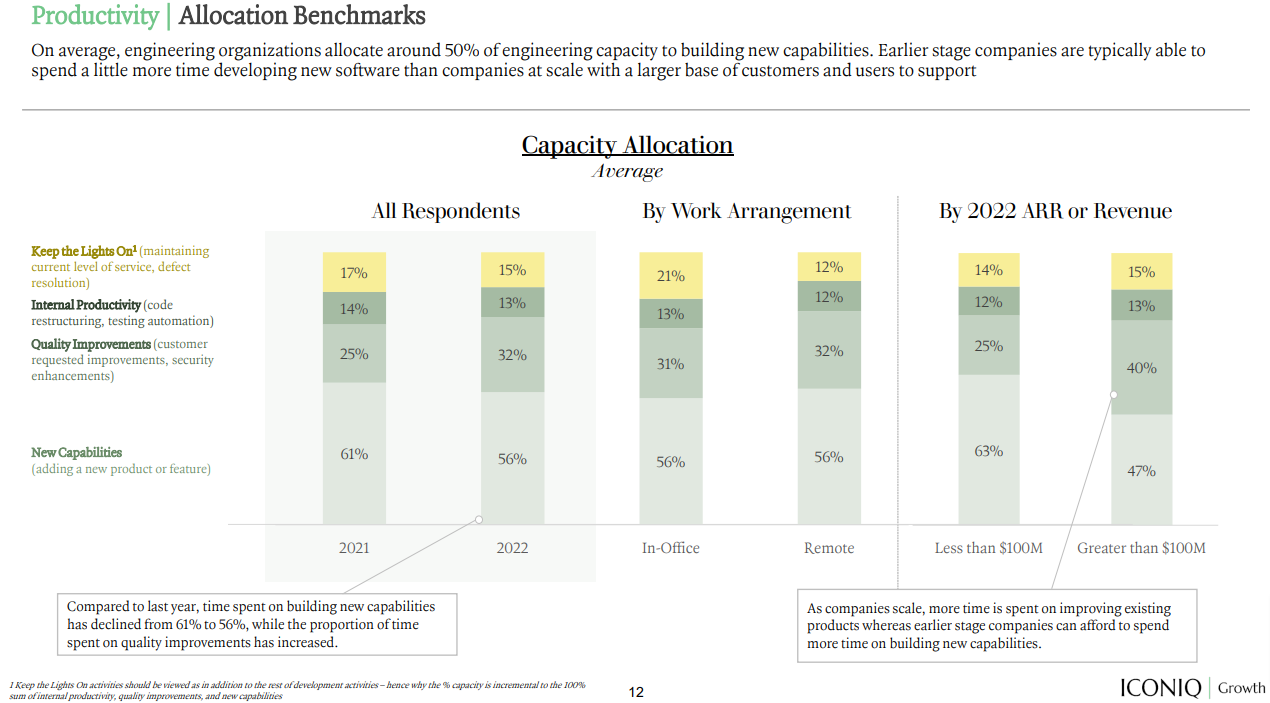
A rare granular break-down of how the R&D income statement line item translates to product development:

Thanks for reading SaaSletter! Subscribe for free to receive new posts and support my work.

My biggest call out: 47% of R&D spend = “New Capabilities (adding a new product or feature)” (for ARR > $100m)

Flagging the spend by category data - 82% people - alongside

OnlyCFO
’s recent “Focus On People Costs”

There is a LOT more in the report like

  • Engineering Headcount Ratios

  • Developer mix (back-end vs front-end vs full stack)

  • Remote vs in-office

  • Use of 3rd party and offshore R&D resources

  • R&D headcount by role (QA, Data Science, Architects, PMs, Management, and so on)

Translating R&D Benchmarks To Long-Term Margins

Amongst public SaaS stocks, company-guided “long-term target operating models” rarely contemplate reducing R&D spend all that much. Examples from Hubspot and PagerDuty are included below.

Generalizing, the margin bridge is primarily driven by improvements in Sales & Marketing plus a few hundred BPS from G&A leverage.

Related Resources:

Interestingly, Morgan Stanley’s “Margin X-Ray” earnings-power framework does NOT assume R&D reductions - May 2022 example here.

RBC’s Summary of Long-Term Targets across their software coverage (via @Jerry Capital)

Why Does This Matter?

Let’s go back to the ICONIQ report.

We saw 47% of R&D spend = “New Capabilities (adding a new product or feature)”

Arguably the next category is equally important from a cash flow-oriented investor viewpoint (aka many of our private equity newsletter subscribers):

40% of R&D spend = Quality Improvements (customer-requested improvements, security enhancements)

When modeling out a downside or “run for cash” scenario, the "quality improvements” *seems* to allow for reasonable logo retention and NRR with a software product that is responsive to customer needs.

Something like a 90% logo retention rate + plus 3-5% annual pricing = 95% NRR???

While stopping new feature development would obviously lower your revenue growth rate, this *theoretical* analysis suggests:

25% revenue on R&D (KeyBank below)

x 53% (i.e. 100% - 47% New Capabilities R&D)

= 13% operating margin improvement via R&D

Taking a very mechanical approach, that also implies new product capabilities should add at least 13% to your revenue growth rate; if not, growth R&D is dilutive to your Rule of 40.

Curated Software Content

This post from

Karim Fanous
on software developer purchasing patterns flagged the ICONIQ report too:

Cumulative
Software development teams rarely buy products
Over the years, I have developed an (untested) hypothesis: software engineering organizations don’t buy products outside a core set, like some of the ones listed below…
Read more
2 years ago · 4 likes · Karim Fanous

Other highlights:

Twitter avatar for @MohapatraHemant
Hemant Mohapatra @MohapatraHemant
This is for SaaS & esp India-SaaS but applies more broadly as well. I’ve been investing in India-SaaS since '18 & harping abt this endlessly to anyone who’d listen. I’ll say it again: the age of “business model innovation” in SaaS is over. It’s done. What does this mean? 🧵1/20
7:42 AM ∙ Feb 10, 2023
536Likes81Retweets
Twitter avatar for @GrandTokamak
Tokamak @GrandTokamak
Software was sticky they said
Image
1:39 PM ∙ Feb 20, 2023
707Likes42Retweets
Twitter avatar for @SaaSletter
Matt Harney @SaaSletter
Like NRR, another instance of the public >>>> private gap in SaaS: Sales quota attainment at public vs private SaaS Data from @repvue
Image
4:20 PM ∙ Feb 15, 2023
13Likes1Retweet
Twitter avatar for @SaaSletter
Matt Harney @SaaSletter
Report from @verticeHQ on SaaS price increases: ~9% annually (excludes license expansion, etc) 74% of vendors raised prices since '19 /1
Image
12:35 AM ∙ Feb 19, 2023
26Likes3Retweets
Twitter avatar for @SaaSletter
Matt Harney @SaaSletter
"Maybe Recurring Revenue" will be a new trend
Twitter avatar for @dalibali2
dalibali @dalibali2
First time seeing a slide that says “$100M ARR” with a footnote 1: “not all ARR is recurring”
9:47 PM ∙ Feb 16, 2023

Thanks for reading SaaSletter! Subscribe for free to receive new posts and support my work.

2

Share this post

SaaSletter
SaaSletter
SaaSletter - R&D Engineering -> Financial Engineering
Share

Discussion about this post

User's avatar
SaaSletter - Platforms vs Pure Plays
With Brex's President / Chief Product Officer + primary research with G2
Dec 14, 2023 • 
Matt Harney
18

Share this post

SaaSletter
SaaSletter
SaaSletter - Platforms vs Pure Plays
SaaSletter - State of Software + AI
First Presented At Bowery Capital's Annual Meeting
Mar 25 • 
Matt Harney
6

Share this post

SaaSletter
SaaSletter
SaaSletter - State of Software + AI
SaaSletter - Coatue on AI -> SaaS Read Throughs
How Much Will AI Hurt Gross Margins?
Nov 20, 2023 • 
Matt Harney
16

Share this post

SaaSletter
SaaSletter
SaaSletter - Coatue on AI -> SaaS Read Throughs
3

Ready for more?

© 2025 Matt Harney
Privacy ∙ Terms ∙ Collection notice
Start writingGet the app
Substack is the home for great culture

Share

Create your profile

User's avatar

Only paid subscribers can comment on this post

Already a paid subscriber? Sign in

Check your email

For your security, we need to re-authenticate you.

Click the link we sent to , or click here to sign in.