
SaaSletter - 2025 Vertical + SMB SaaS Benchmarks From Tidemark
A Uniquely Granular + Thesis-Driven Report

Tidemark 2025 Vertical + SMB SaaS Benchmarks
Tidemark (h/t Dave Yuan, Andrew Walsh + co) recently released their 2025 Vertical + SMB SaaS Benchmark report (60 slides, n=200+).
This is one of the most granular AND thesis-driven reports in the industry, so Cloud Ratings was honored to serve as a report partner.
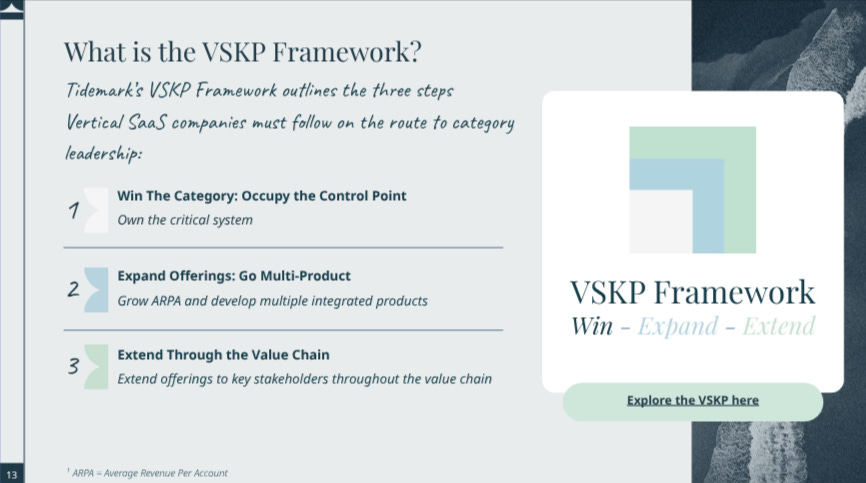
Tidemark’s Vertical SaaS Knowledge Project (VSKP) Framework frames the report:
The report classifies companies into primary product areas (i.e, Back Office vs FinTech) with our call-outs of particularly key metrics:
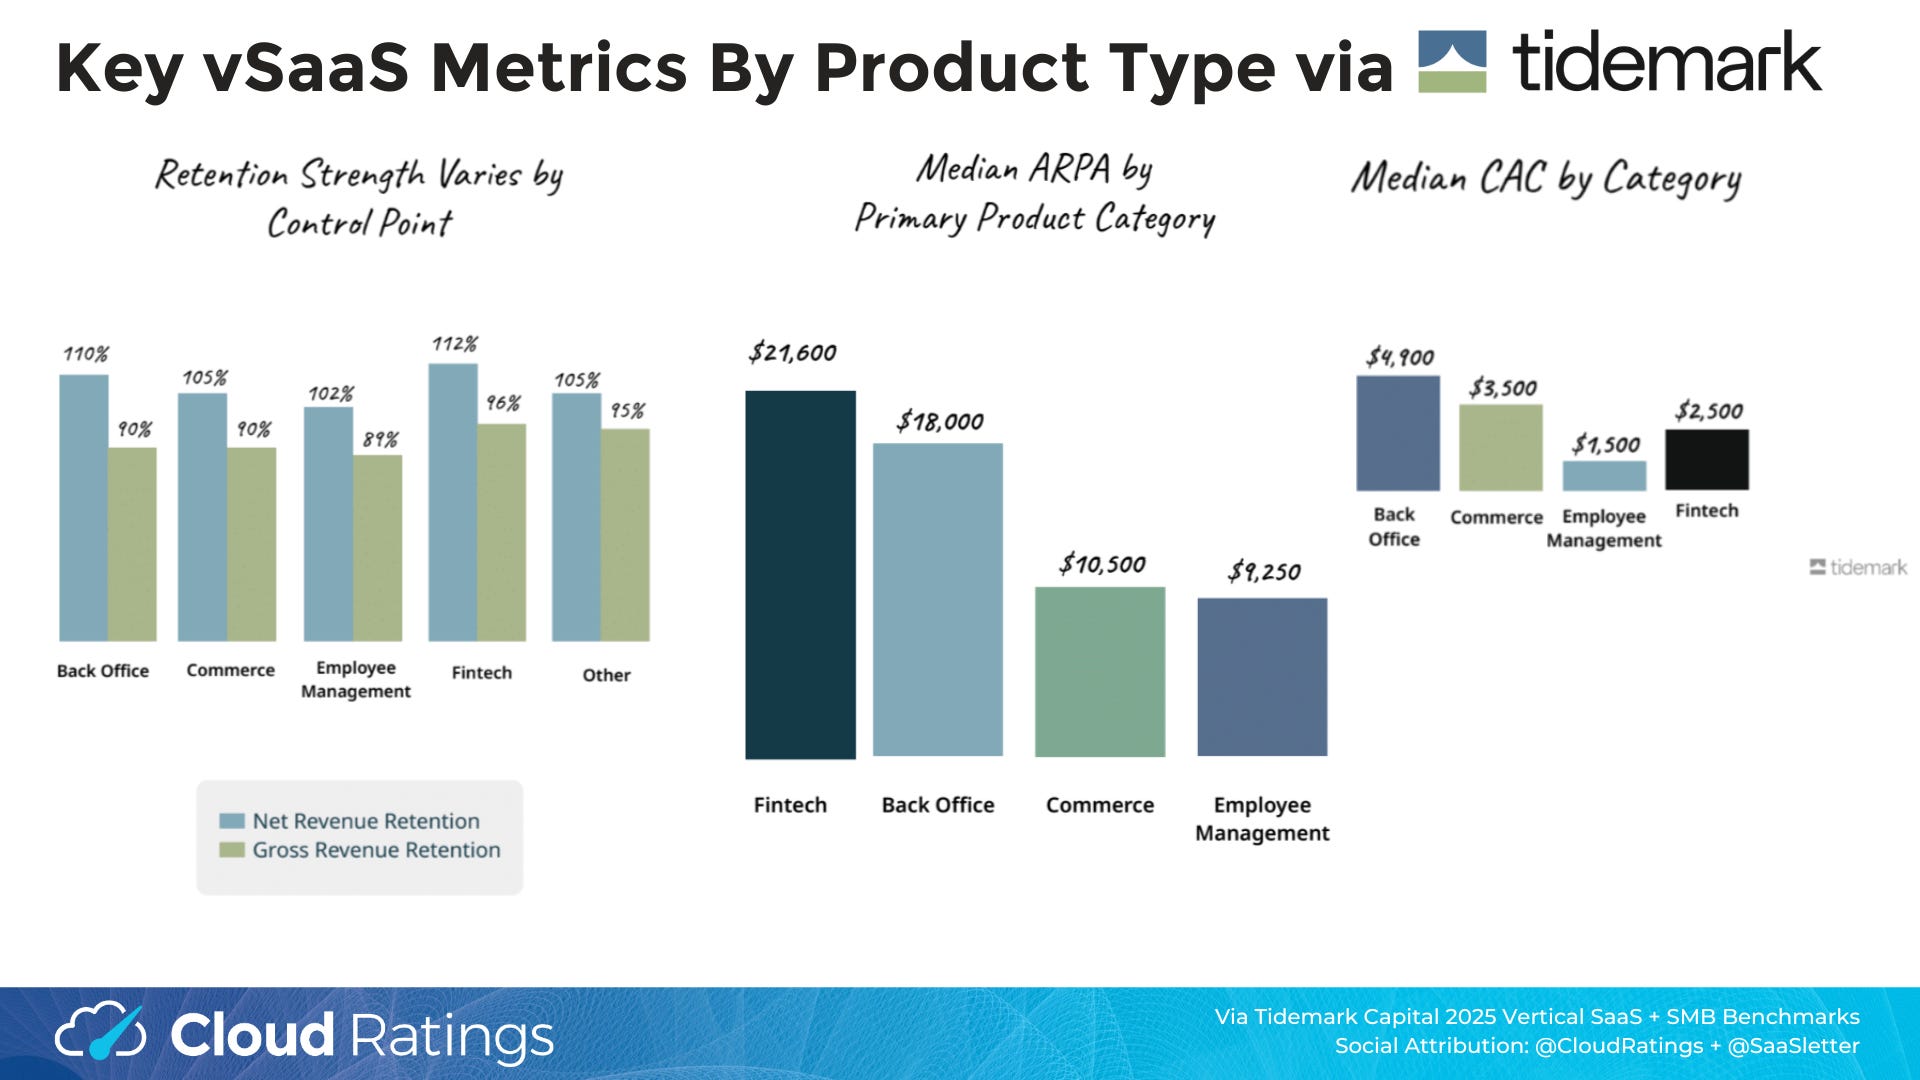
Of particular note:
FinTech Gross Retention of 96% (vs ~90% for other product types): From a *compounding growth* perspective, having only to backfill 4% logo churn is a far, far easier headwind than replacing ~10%+ of logos typically seen in SMB + many vSaaS categories.
Low CACs: All categories exhibited CACs below $5,000. Regardless of revenue per account, this is excellent in absolute terms.
We modeled1 the Tidemark data into estimated LTV / CAC ratios, including LTV on an 8-year customer life basis, to normalize for extreme gross retention rate scenarios (i.e., FinTech 96% GRR implies 25-year customer lives!). Even when normalized, the LTV/CAC ratios implied from the Tidemark sample are VERY strong (average = 23.5x).
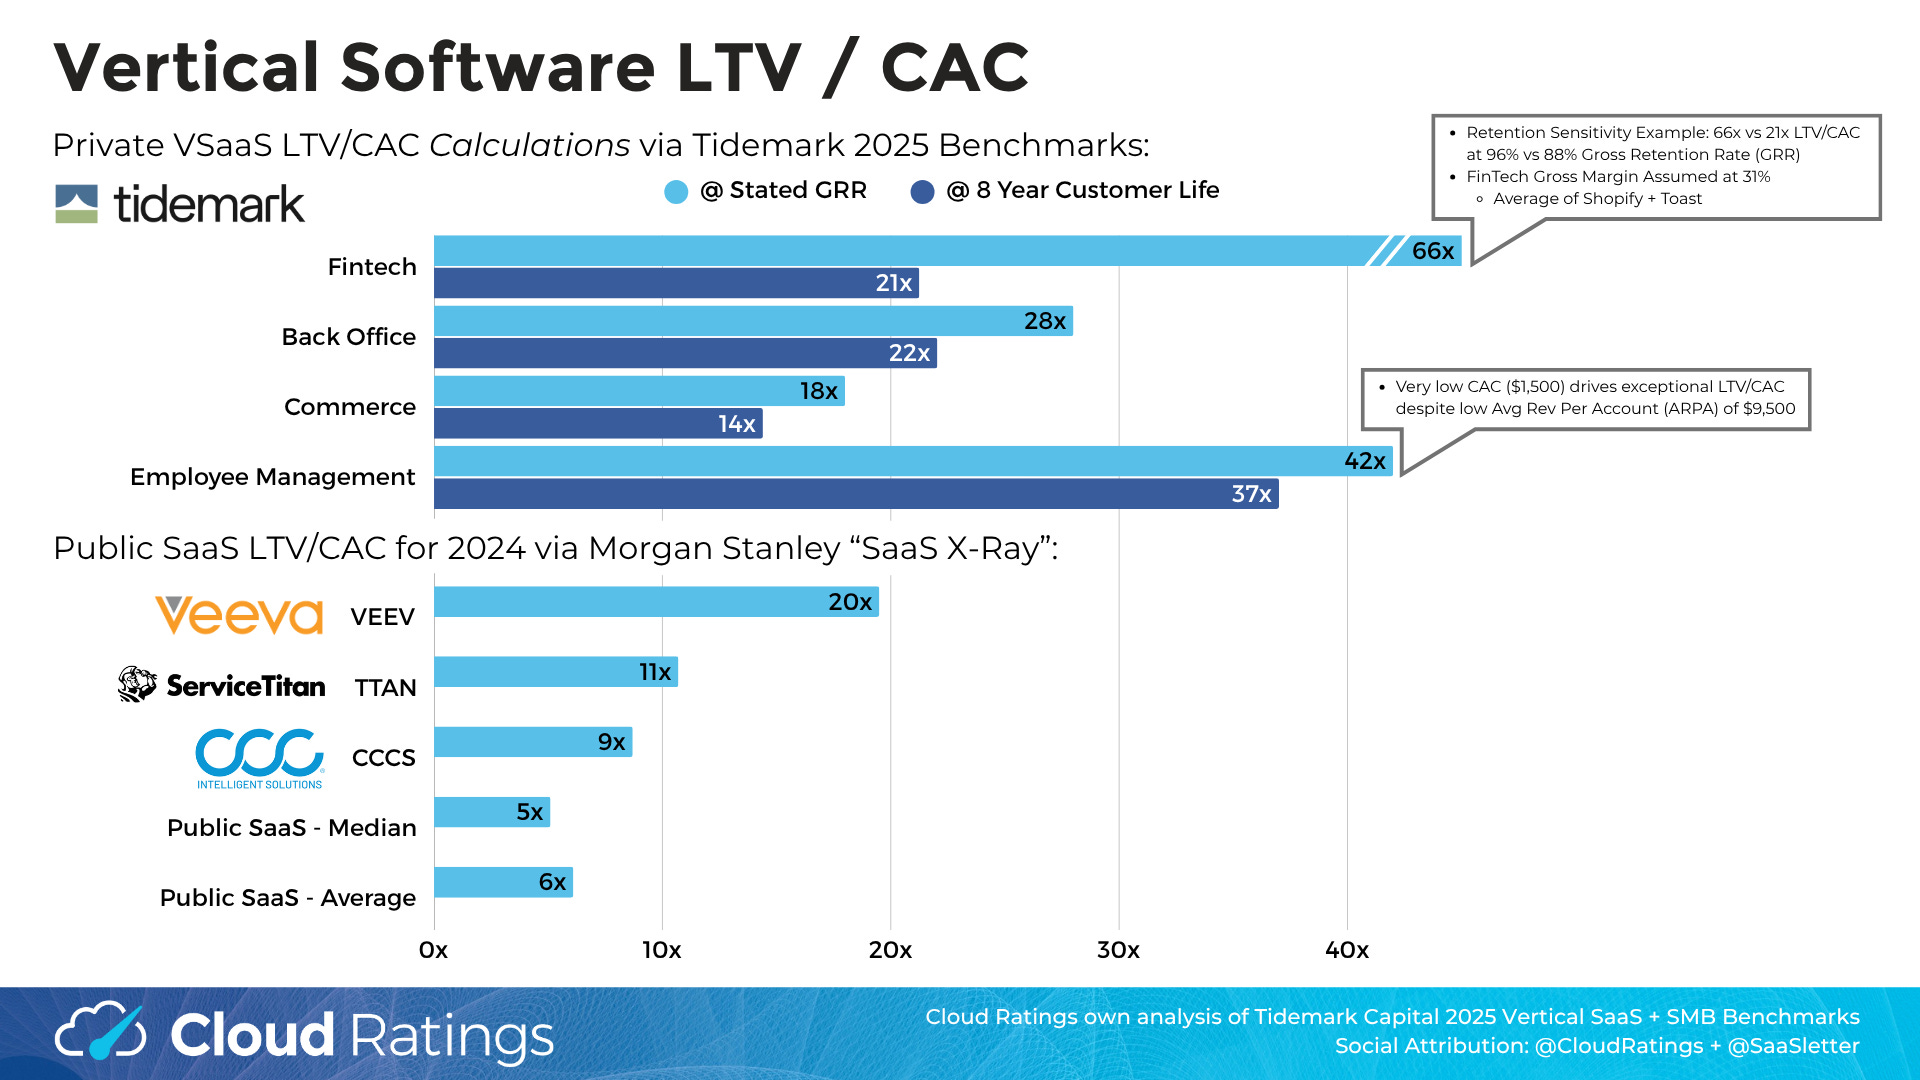
Of note, publicly traded vSaaS also exhibit relatively high LTV/CACs - 9x-20x (for VEEV, TTAN, CCCS) vs 5x-6x for the overall public universe.
Multi-Product Investment Thesis Support
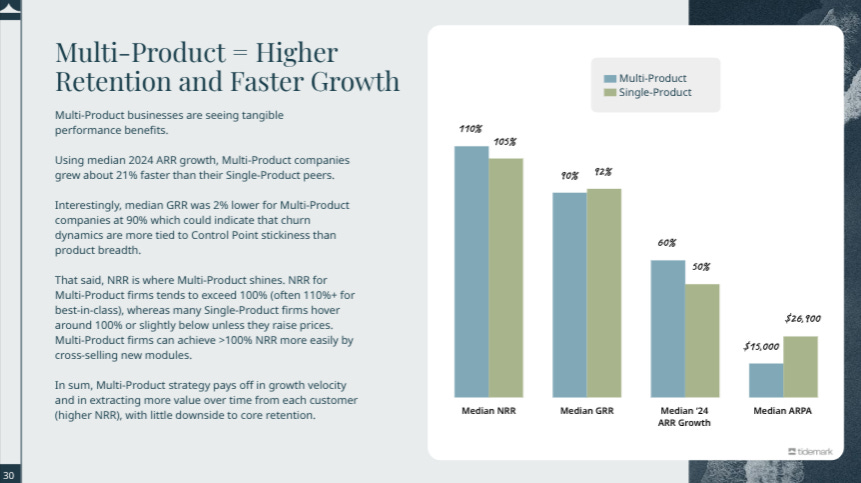
The Tidemark report covered multi-product data in depth - key excerpts here with much more detail in the full report.
Multi-product outperforms on the key growth + net revenue retention metrics (despite substantially lower revenue/account and slightly lower gross retention)
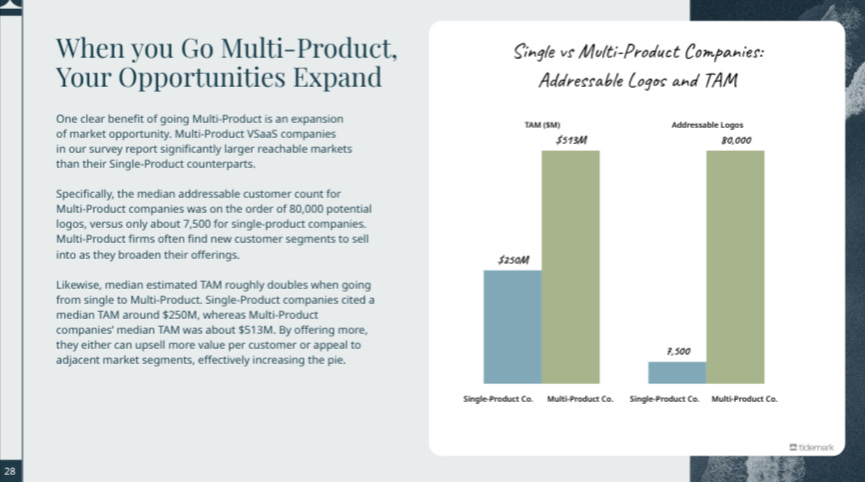
This TAM expansion slide speaks for itself:
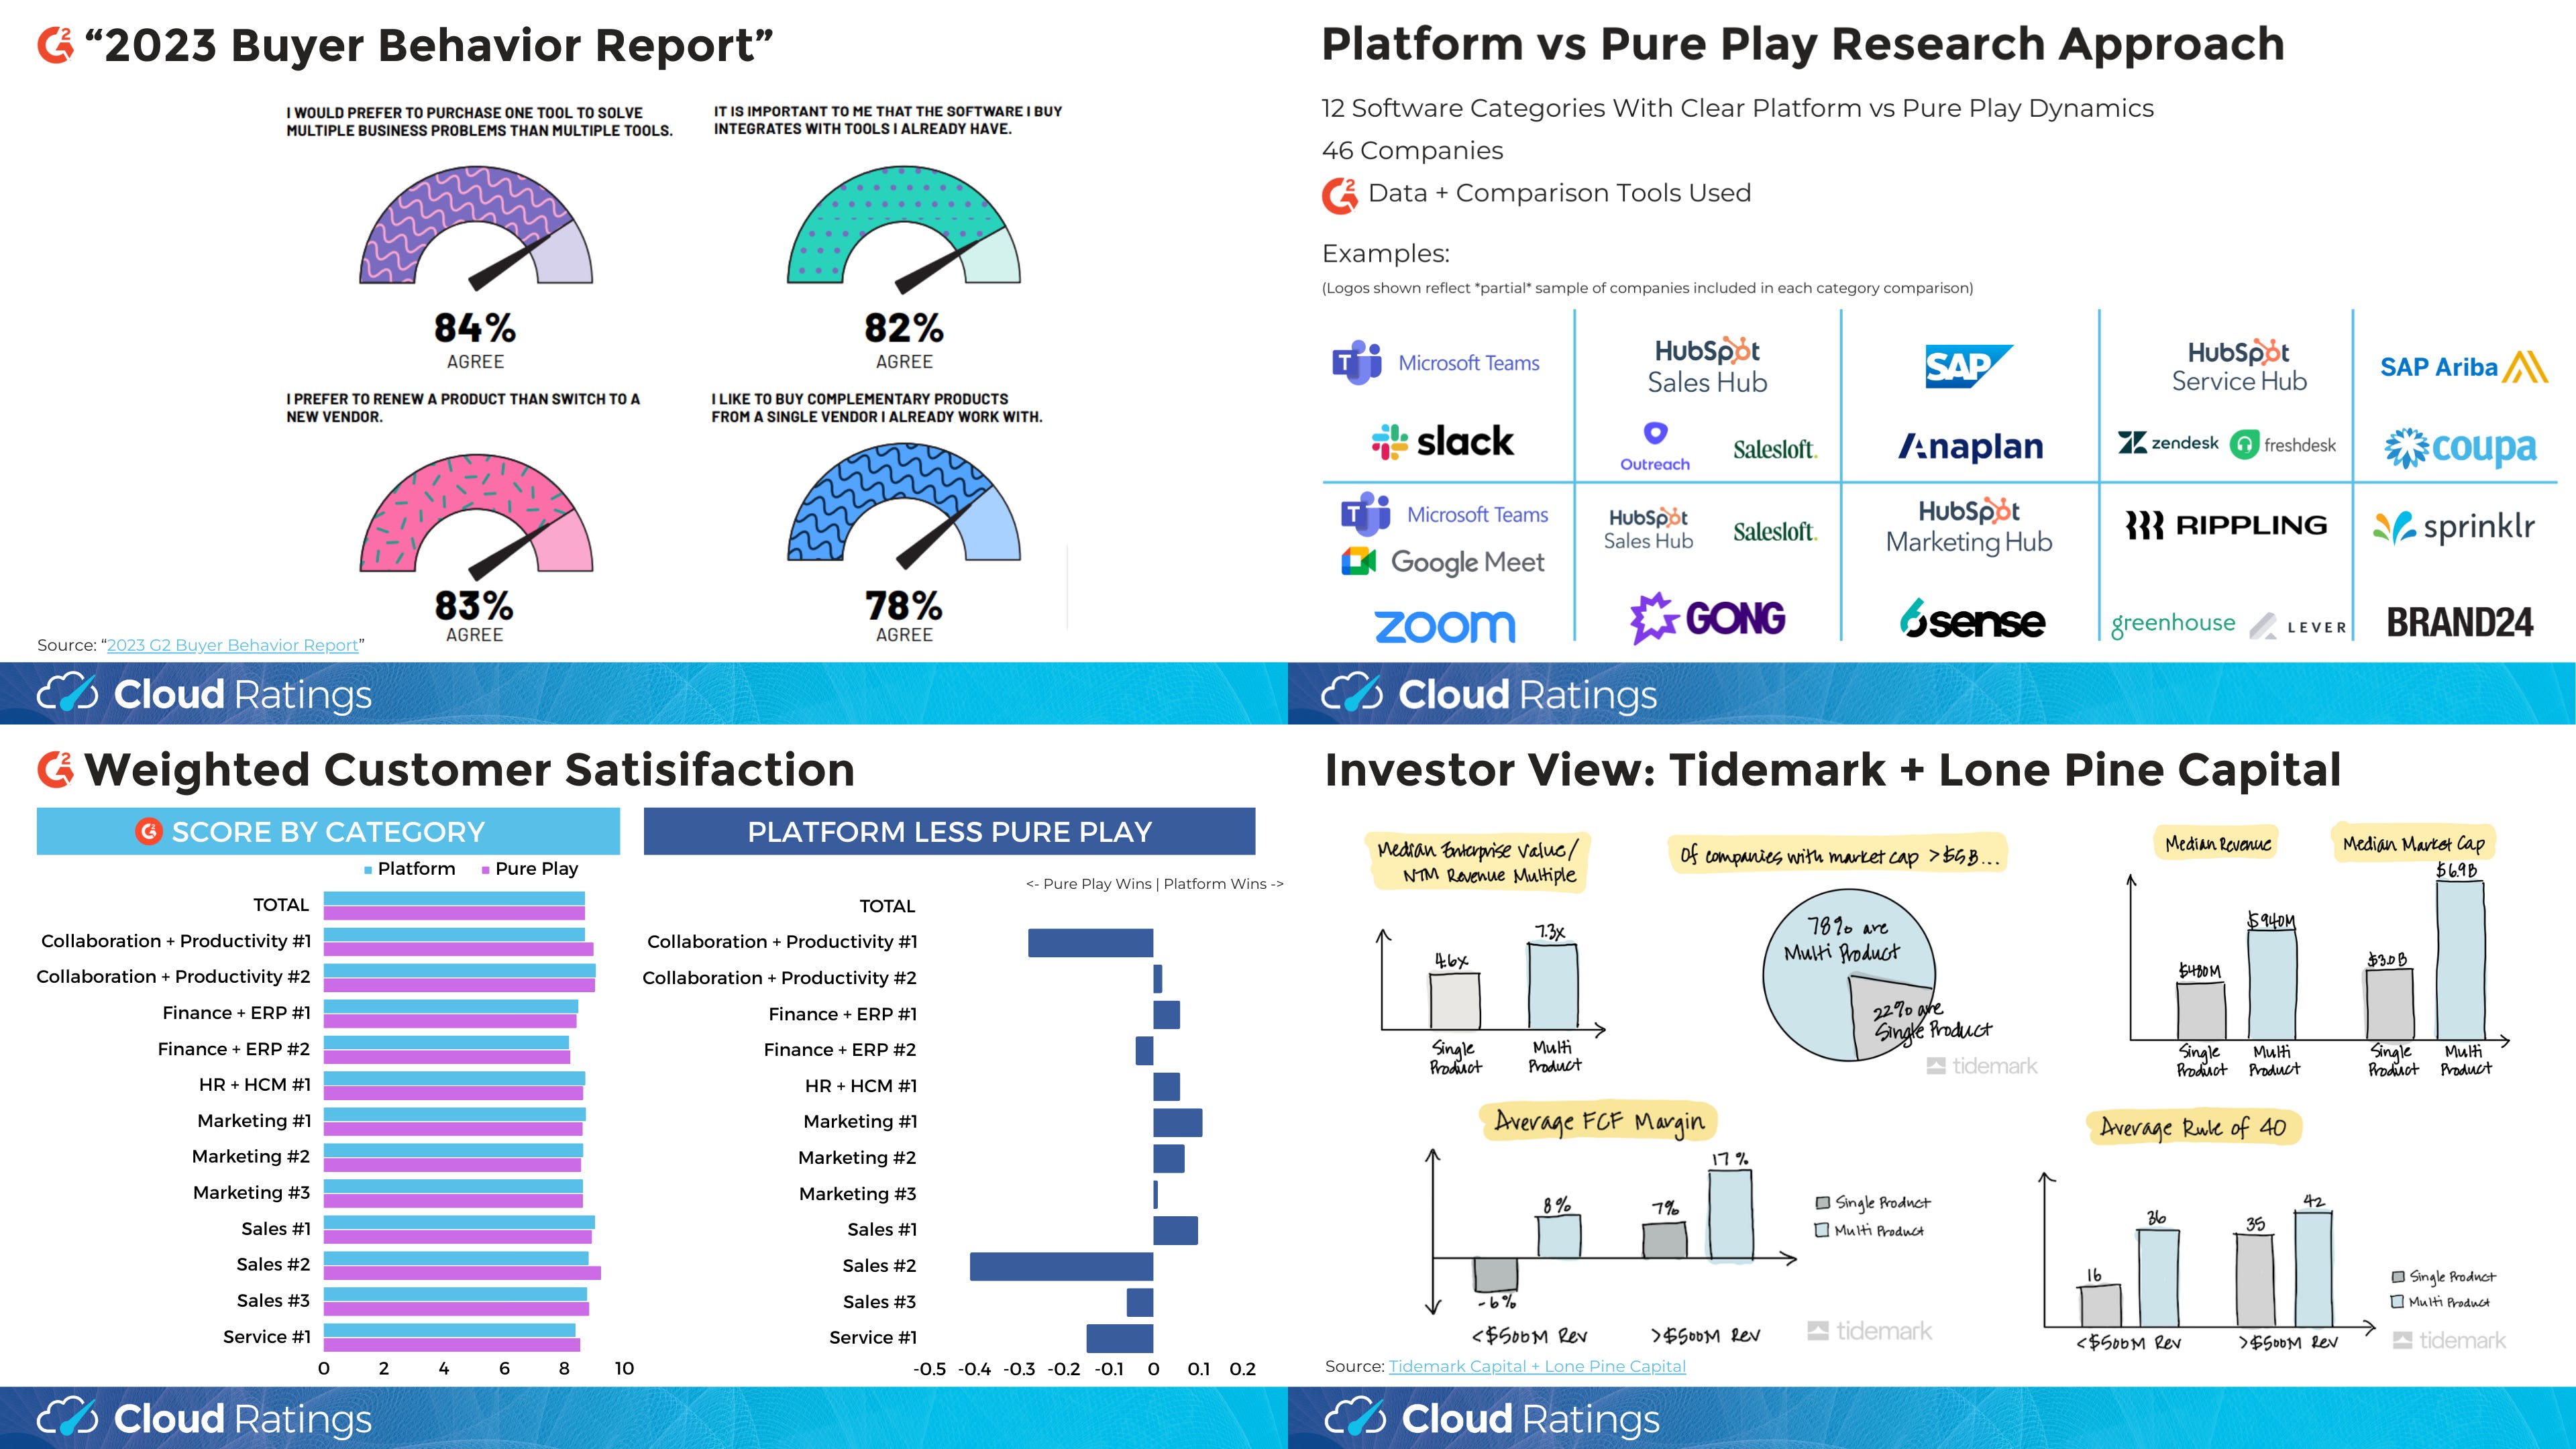
RELATED RESEARCH: In part inspired by Tidemark/Lone Pine’s work on multi-product outperformance, we examined “Platforms vs Pure Plays” in partnership with G2 in late 2023:

Key messages:
Platforms generated substantially equivalent customer satisfaction versus pure play specialist offerings
G2 Buyer Behavior data shows buyers consistently prefer working with one vendor
… with more in our 32-slide, downloadable “Software Platforms vs Pure Plays” report.
AI x vSaaS/SMB Benchmarks
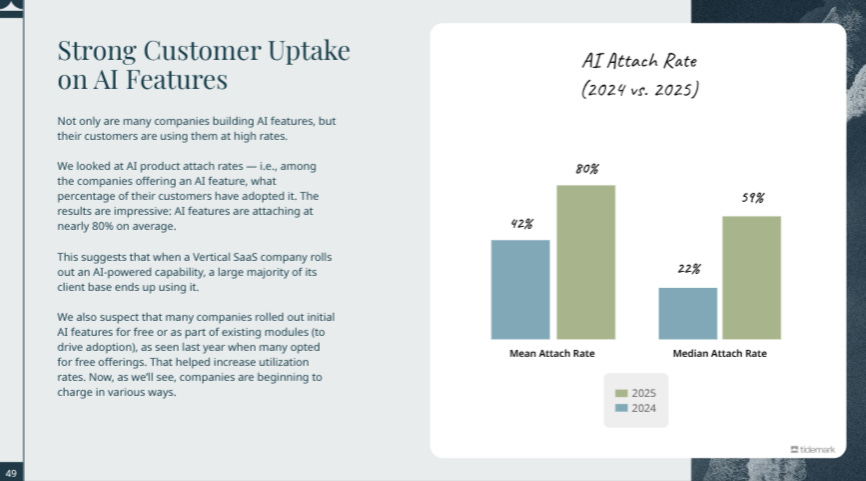
Tidemark also covered AI penetration in vSaaS/SMB. Key excerpts:
Attach rates are growing explosively (median: 2024: 22% → 2025: 59%):
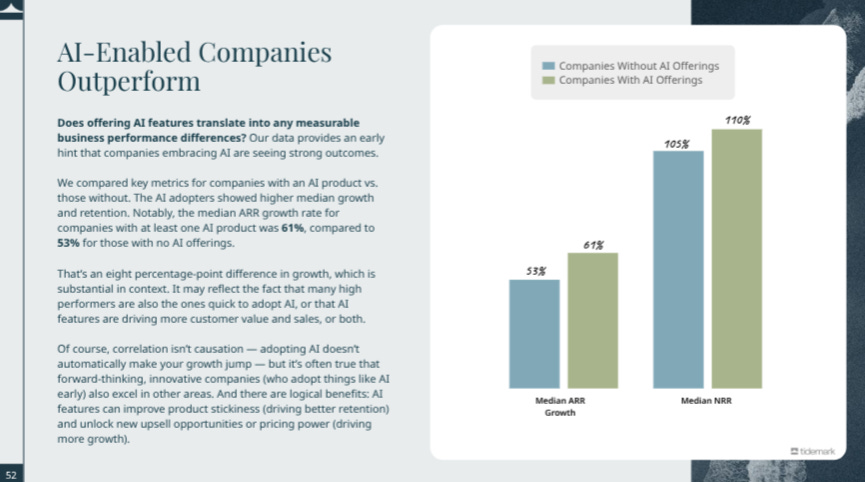
… with AI-enabled vendors posting moderately higher growth + retention rates:
There is a *lot* more in the full Tidemark report. As always, do your own work + go read the full report.
Vertical Software Investing Podcast With Dave Yuan (2024)
VIDEO | AUDIO: Apple Podcasts | Spotify | All Platforms
We’re re-highlighting our *2024* vertical software investing podcast with Dave Yuan, Founder of Tidemark.
About Cloud Ratings
In mid-2024, we announced a research partnership with G2 - more here:

with this slide showing how our G2-enhanced Quadrants (like our recent Sales Compensation Software) release, this business of software newsletter you are reading, our podcasts, and our True ROI practice area all fit within our modern analyst firm:

Other LTV modeling notes: 31% gross margin for FinTech (based on the average of the most recent quarter gross margins for FinTech product lines of Shopify and Toast). 60% gross margin for Commerce (based on mix including offerings like POS, Leads, or Demand Generation).