

We will get right into it:
ICONIQ “State of AI” - AI Costs + AI Gross Margins
ICONIQ (h/t Vivian Guo + team) released their latest July 2026 edition of the “State of AI” report (47 slides, ungated).
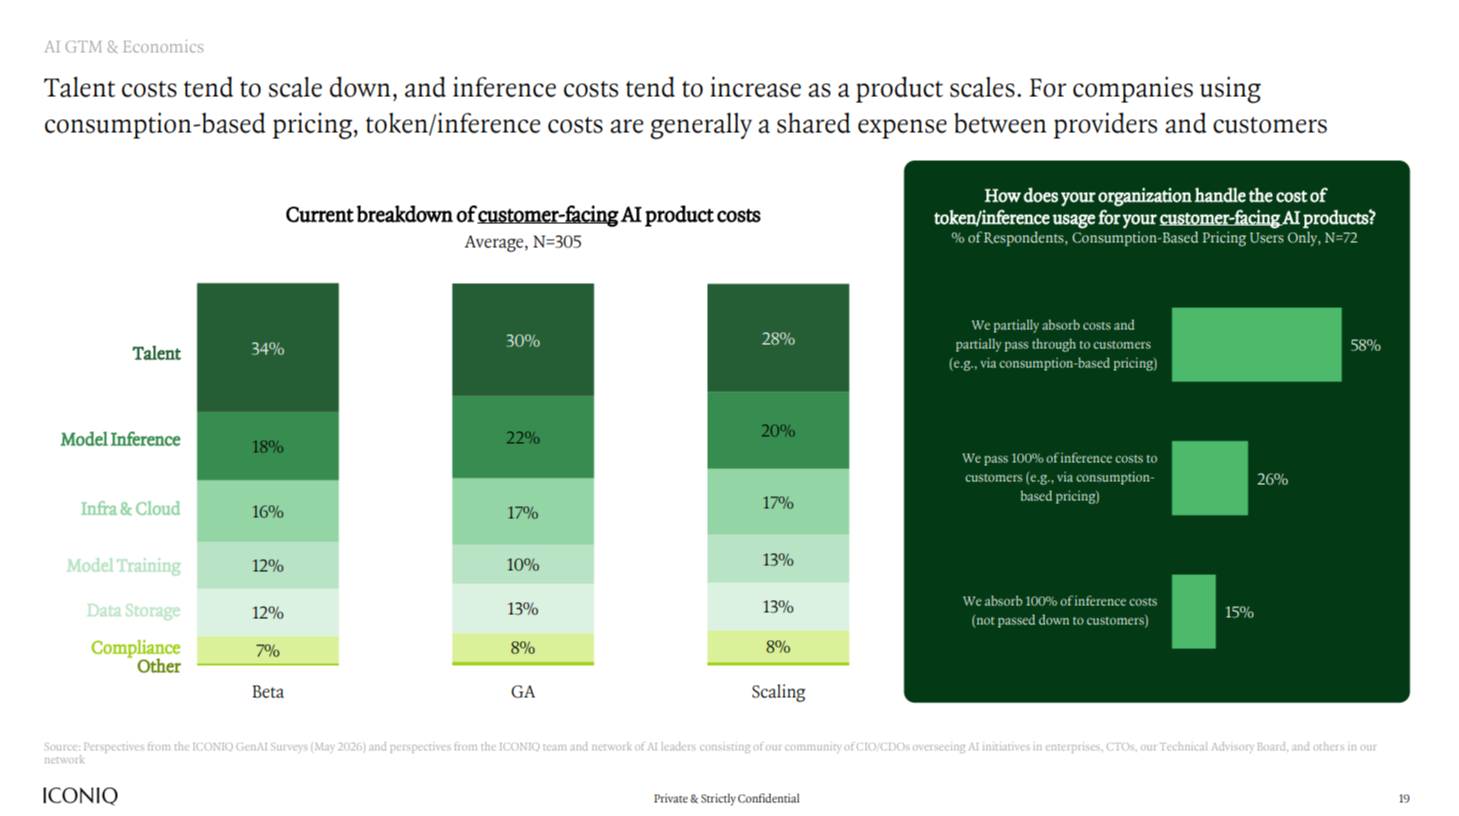
Their granular AI cost structure chart evolution from Beta → General Availability (GA) → Scaling once again leads to this conclusion:
Key message: There seem to be too few fixed costs to generate software economics.
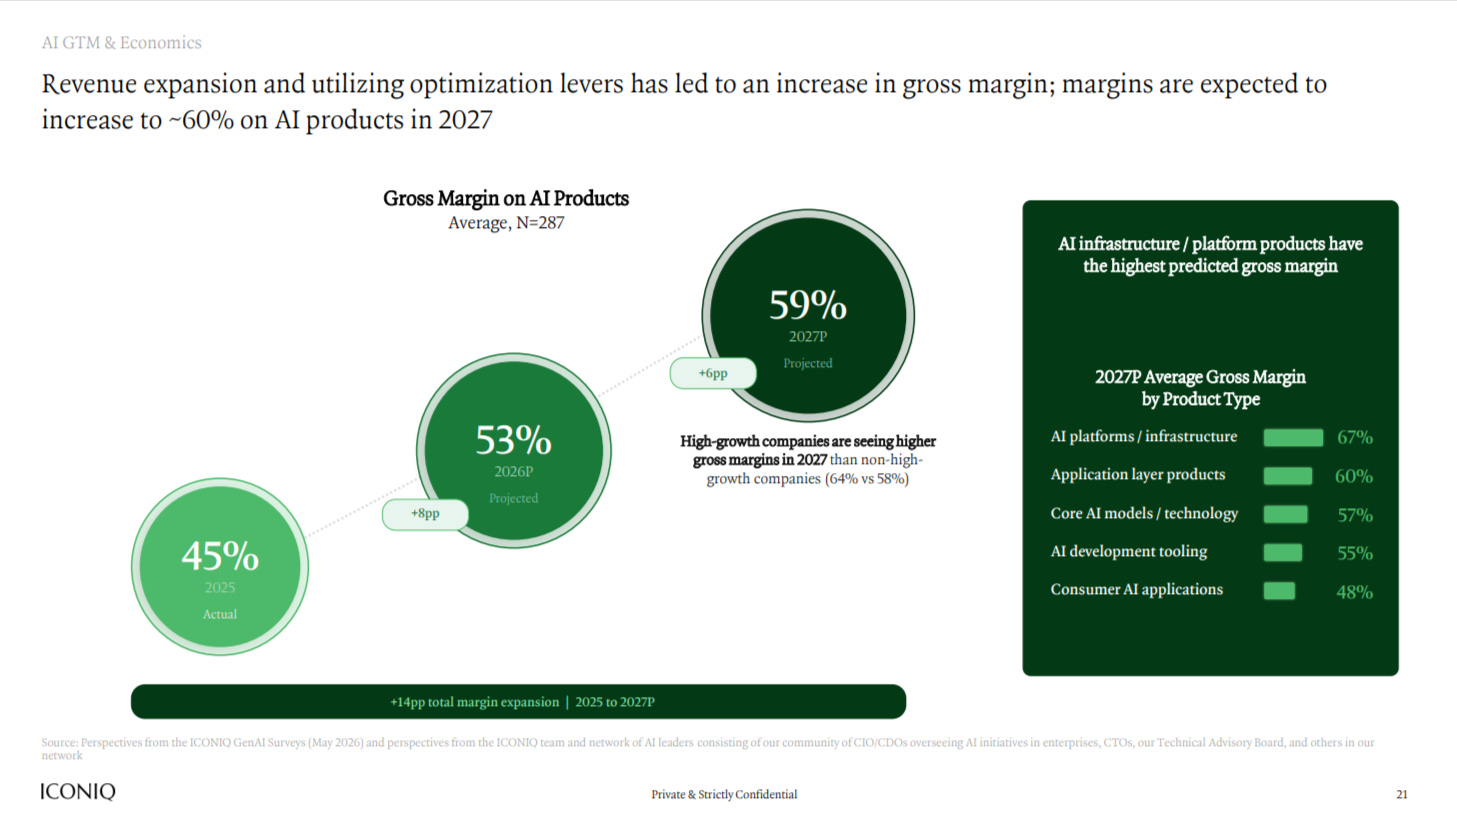
Looking strictly at customer-facing AI product costs, the 14% projected increase in AI Gross Margins (2025: 45% → 2027: 59%) seems questionable.
For our core software readers, the 2027e 60% gross margins for Application Layer Products seem encouraging.
However, the change in the unit economics survey suggests gross margin improvement is supportable: 66% of respondents improved their cost per query by 10%+, with 19% at 30%+.
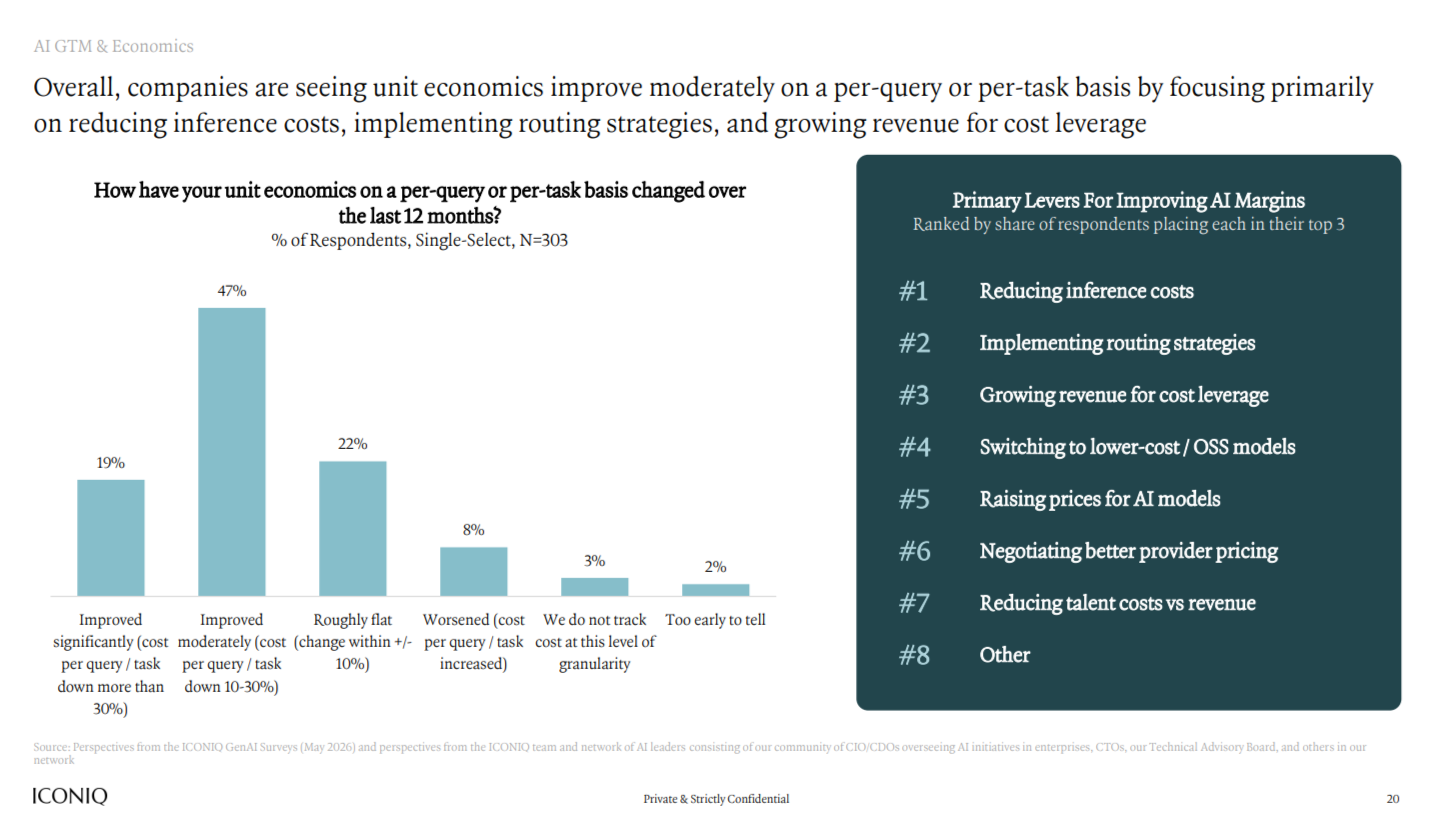
Key unit economics drivers: #1 reducing inference costs, #2 implementing routing strategies, #3 revenue growth through cost leverage, #4 switching to lower-cost/open-source models. In our view, these are believable, “blocking and tackling” drivers.
ICONIQ “State of AI” - AI Revenue Mix
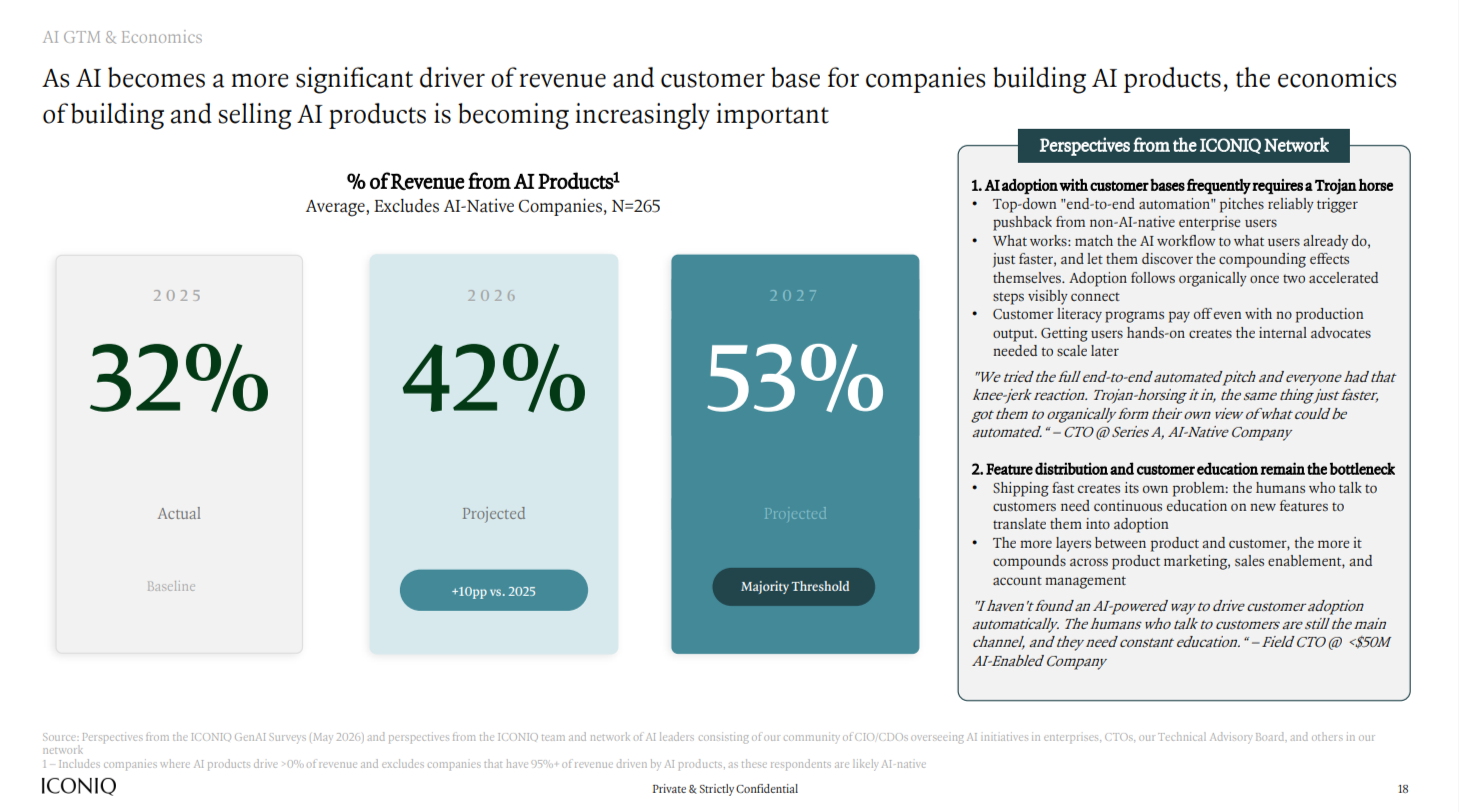
The revenue mix data for non-AI-native companies was striking:
2025A: 32% AI as % of total revenue
2026E: 42%
2027E: 53%
We’ve tracked public company disclosures of their AI metrics. Through early 2025, creating this summary was a heavy lift - actual, meaningful disclosure was limited.
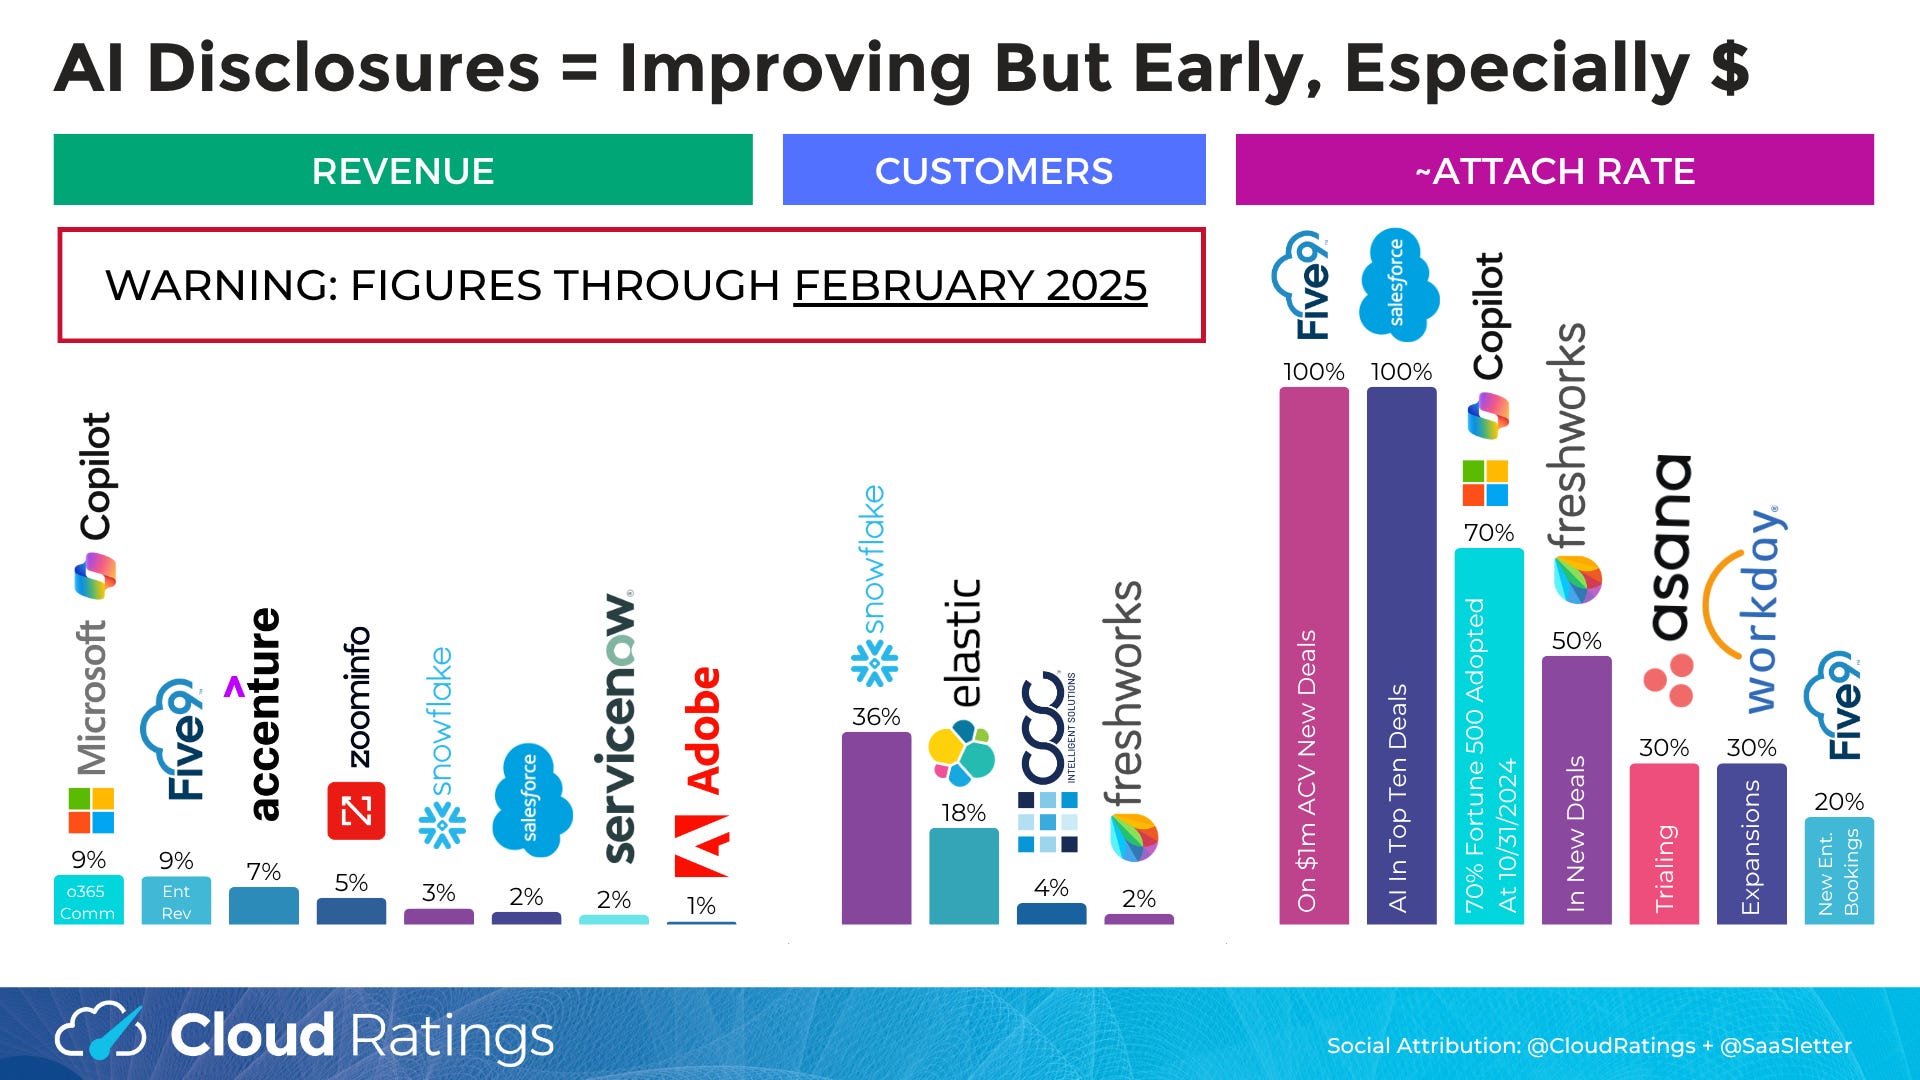
AI disclosure transparency has improved dramatically. Granted, what is disclosed varies widely - like new deal attachment rates or stats on user actions/adoption… but no-to-limited clean AI financials.
Working with public company disclosures through June 2026 for 20 (at least partially) AI transparent companies, these are the only “clean” apples-to-apples AI mix ratios relative to ICONIQ:
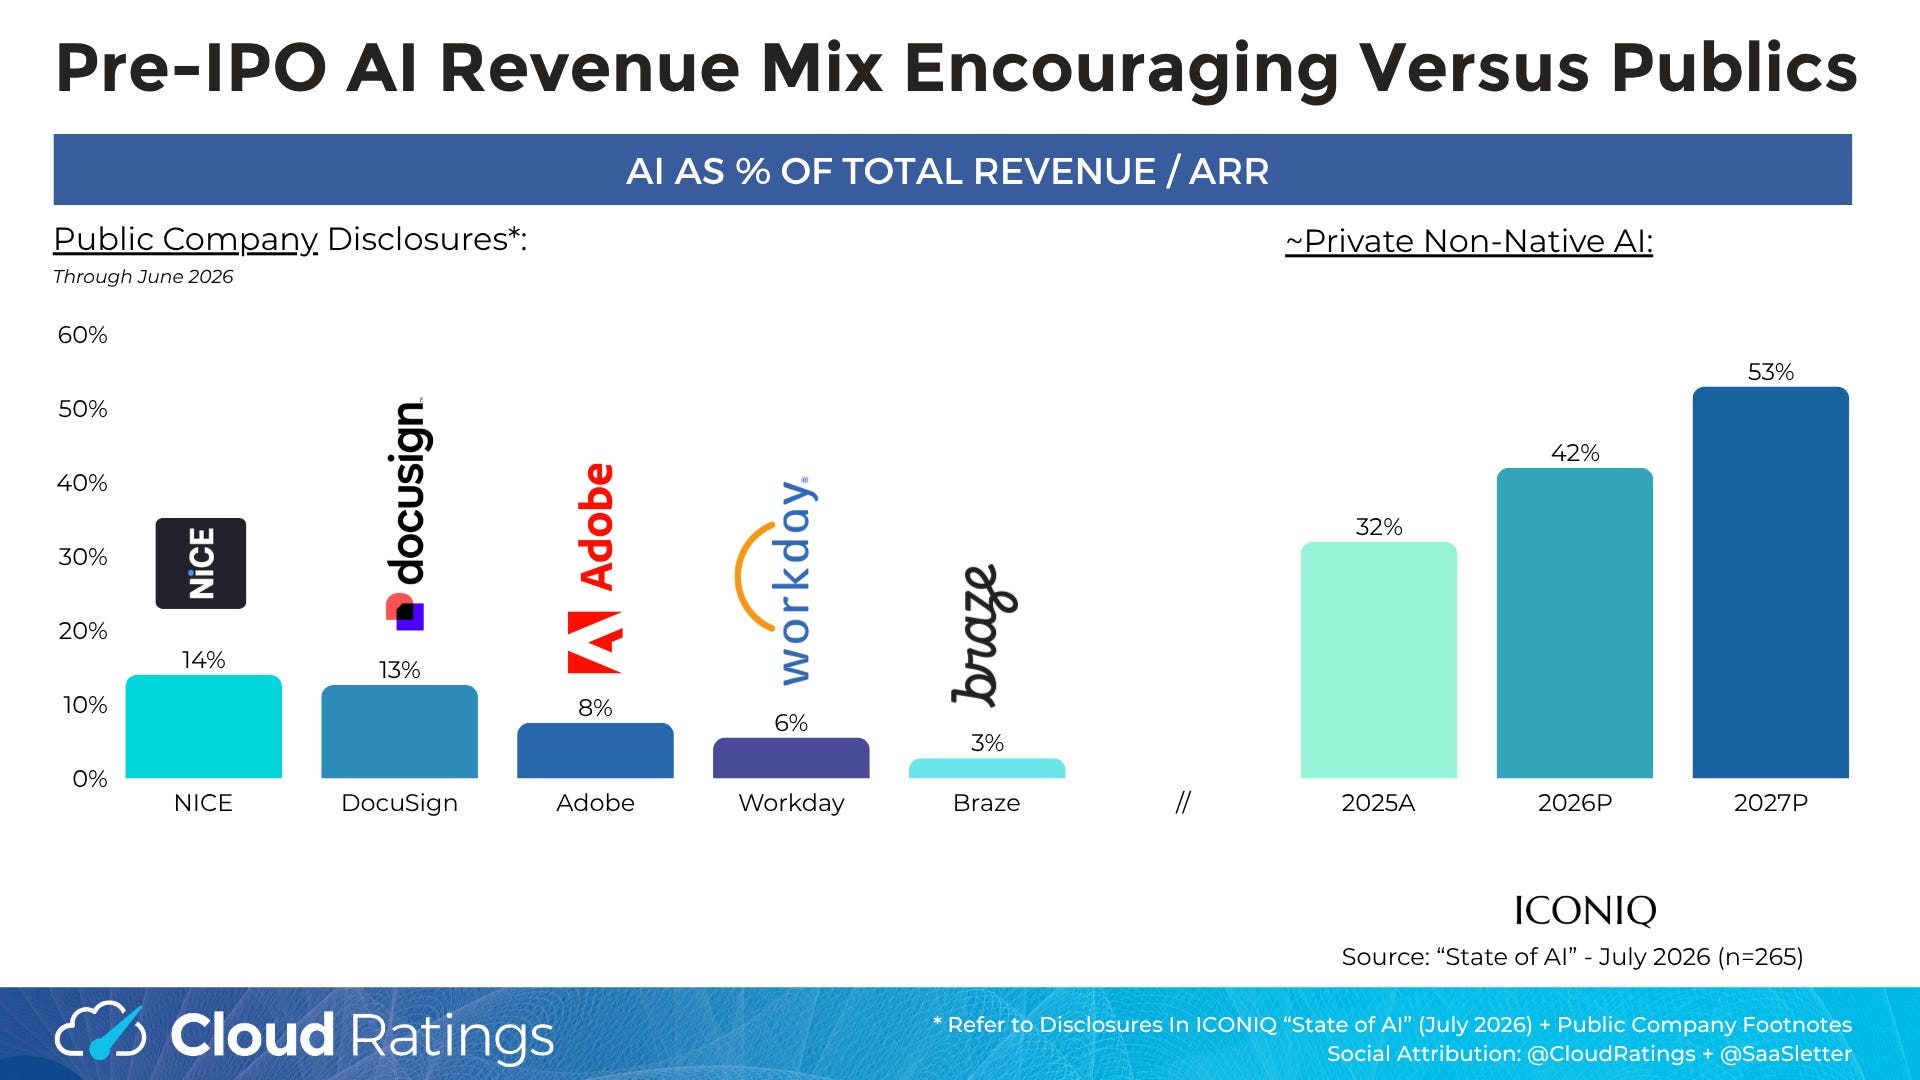
For the “Is Software Dead?” debate, you could interpret ICONIQ AI's high mix as a positive sign that smaller private non-AI natives can innovate and quickly monetize AI within their software platforms. Or you could focus on public companies’ HSD/LDD AI penetration rates ~3.5 years post-ChatGPT launch as evidence that legacy software will be disrupted.
Other public disclosures - like deal attach rates - outline how/whether/when the ICONIQ-mix levels could be achieved. This is an “apples vs oranges” chart set at the same scale, so use this for ideation only:
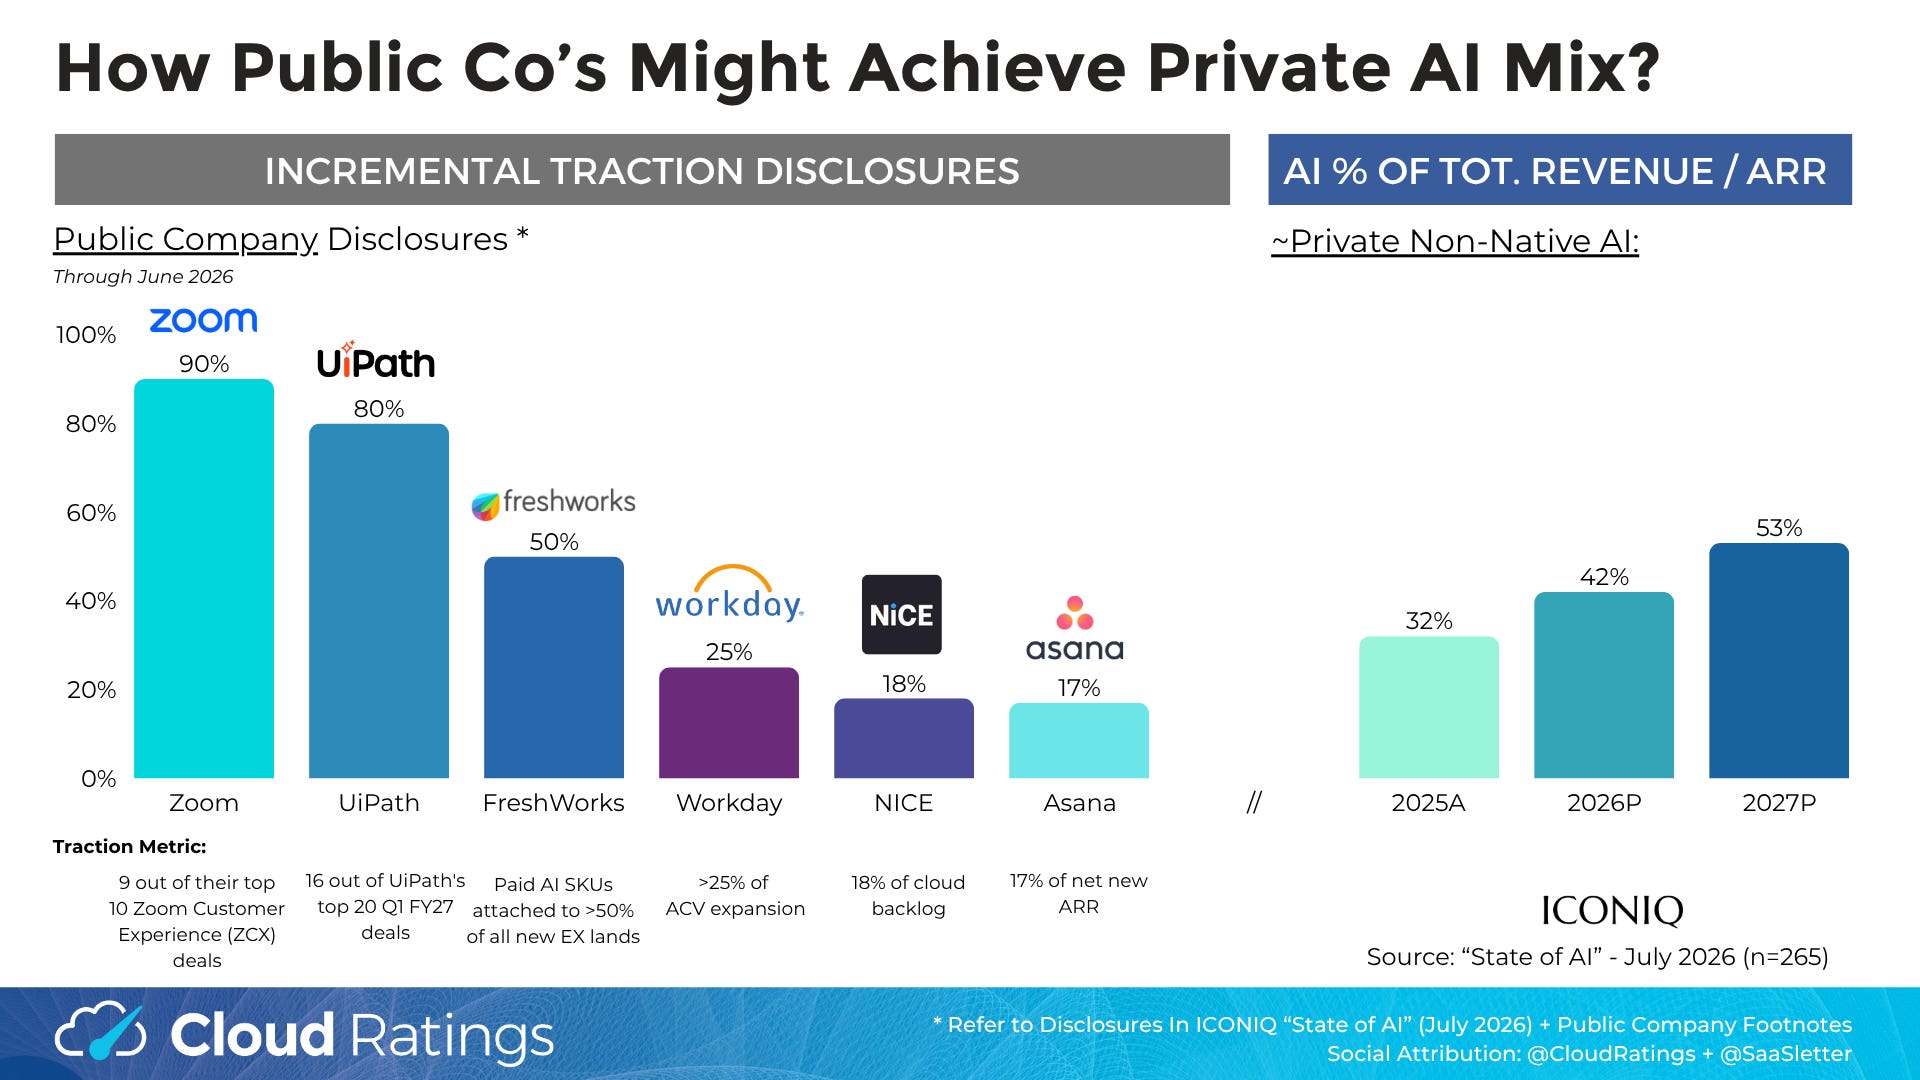
Coming to an accurate view is company- and category-specific… requiring a range of modeling sensitivities, which inspired this:
Related Resource: Our Cloud Ratings Quantitative Strategy Analyst Nick Aiken created a dynamic model template - including the impact of cannibalization - to help answer:
Does AI Revenue Offset The Loss Of Legacy Seats?
How Fast Are We Actually Converting To An AI-First Business?
Can A High-Performing AI Business Save Us From Flatlining?
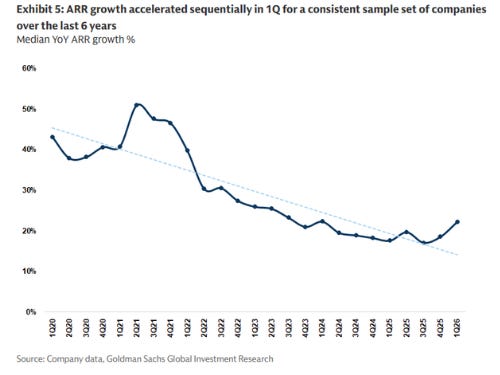
All of which can help you see scenarios (by variables like AI mix, cannibalization rate, legacy + AI growth rates) where/when/whether AI leads to an overall re-acceleration (related chart = Goldman Sachs software sector-wide ARR growth):
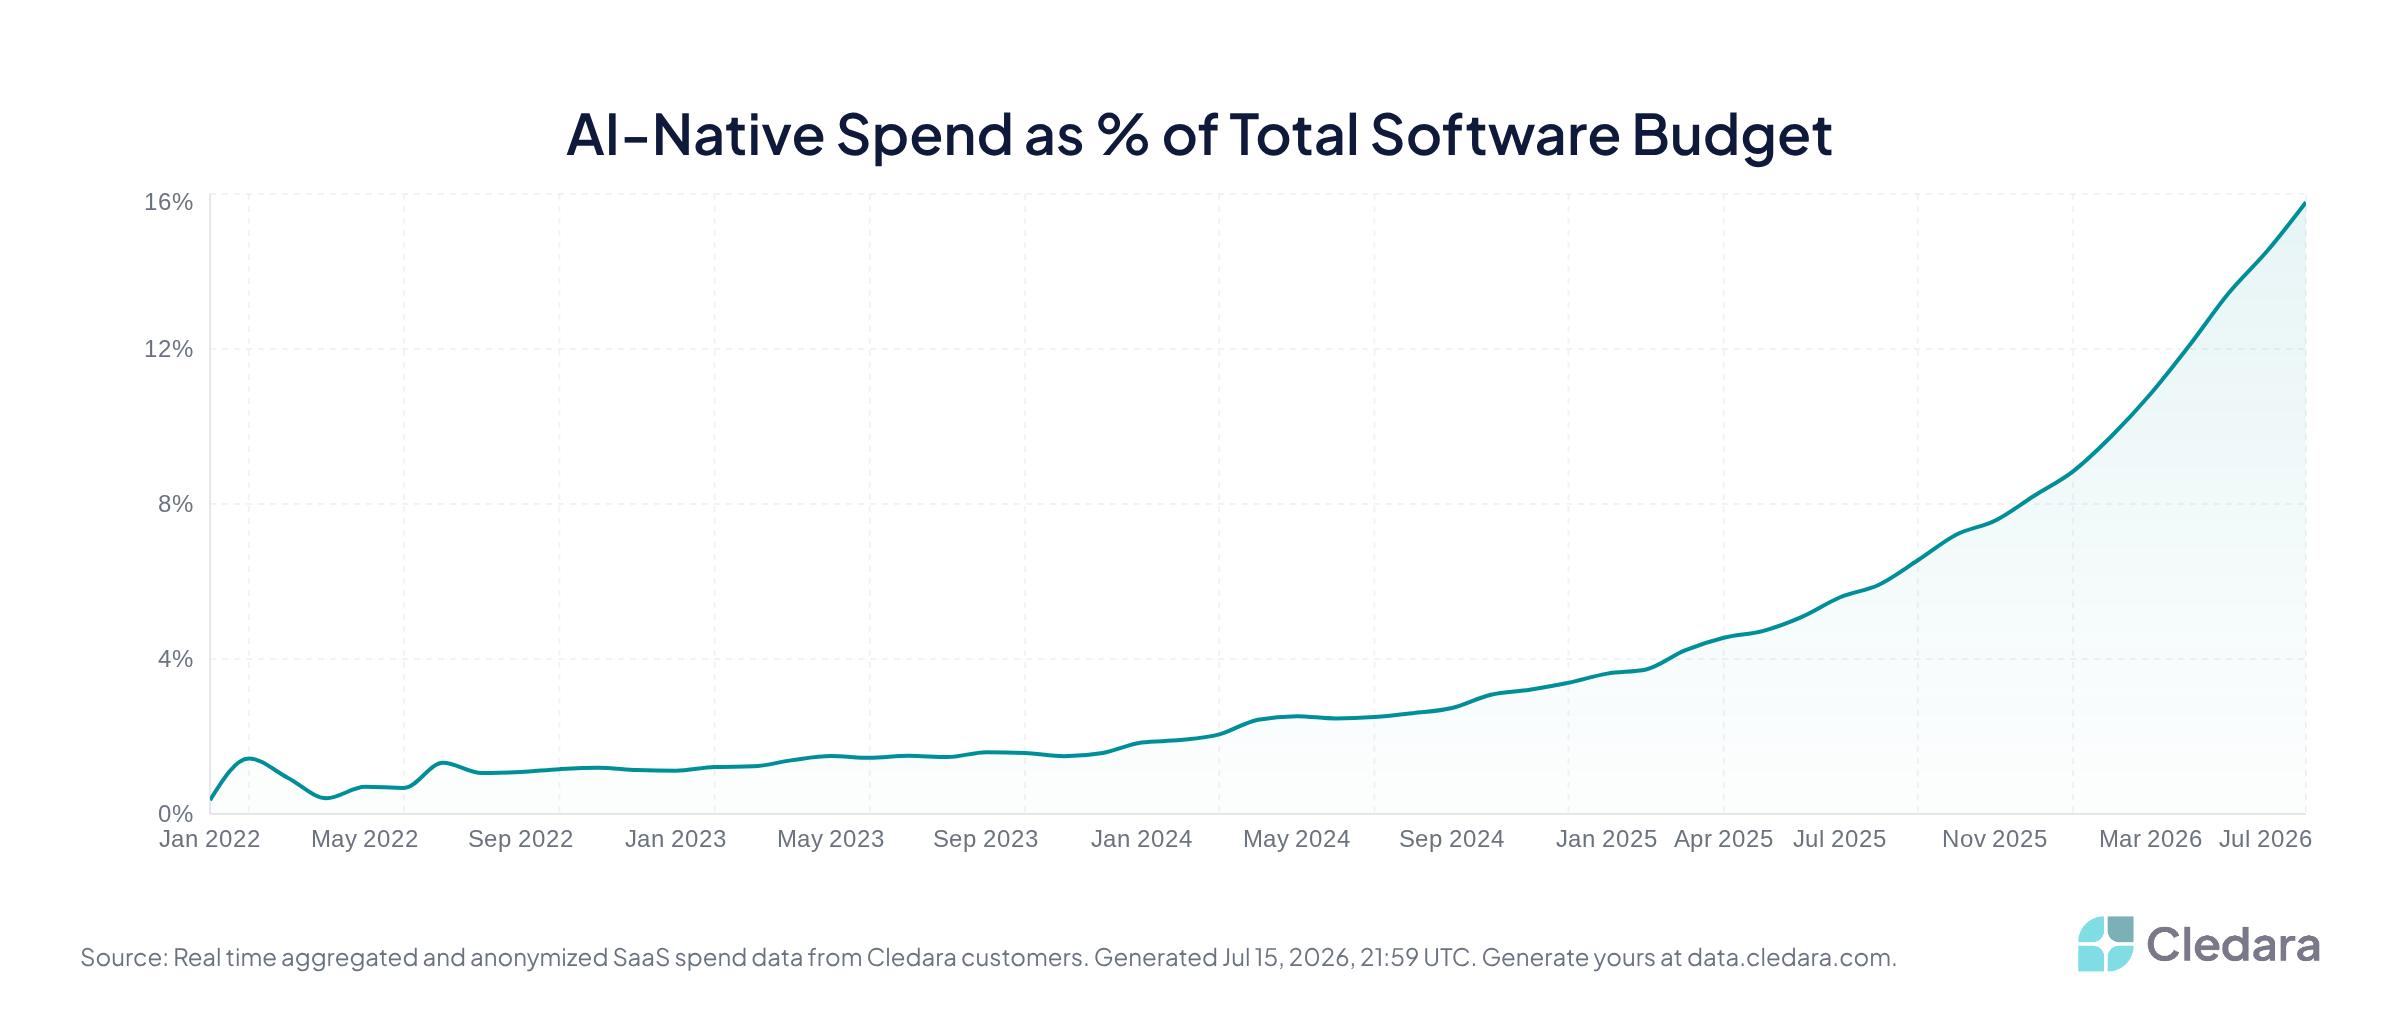
While this AI as a % of software spend data set from Cledara, a software spend management platform (h/t Brad van Leeuwen) could help you choose assumptions on both cannibalization and relative growth:
ICONIQ “State of AI” - More Excerpts
These excerpts should speak for themselves. And we will remind you to always go read the full ICONIQ x AI report:
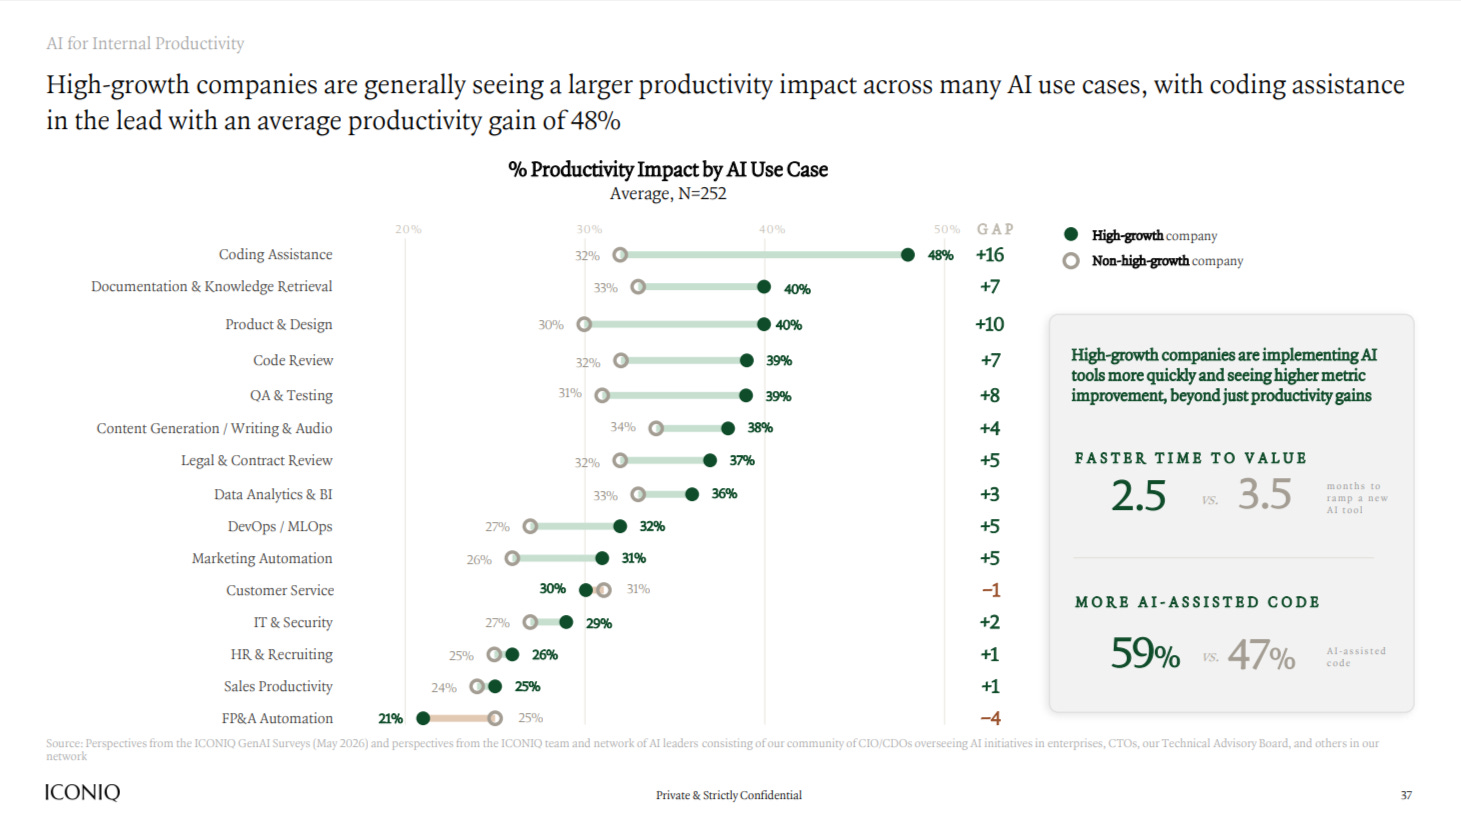
Excellent data for validating AI ROI:
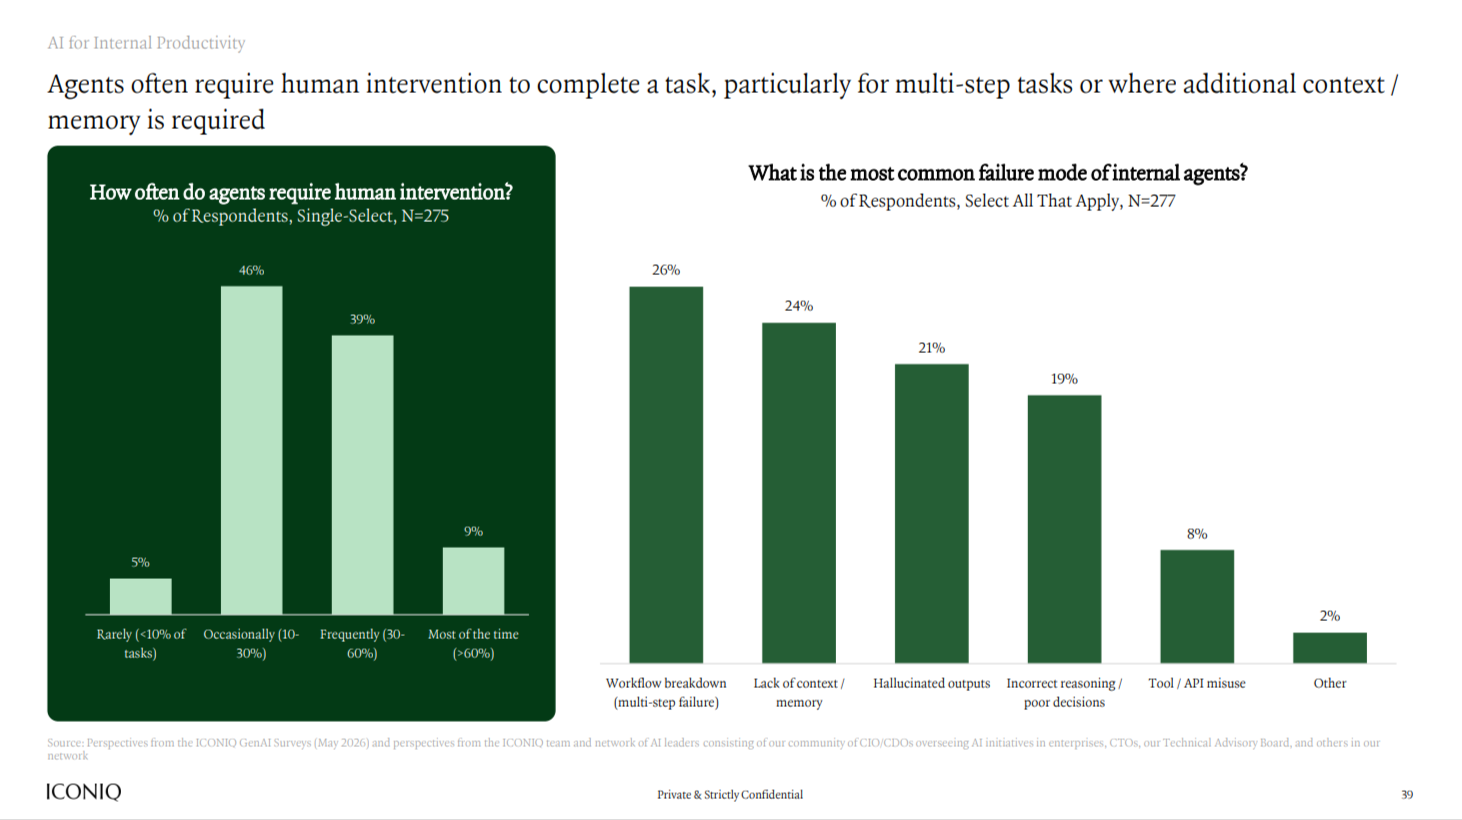
Data on agent risk and human intervention needs:
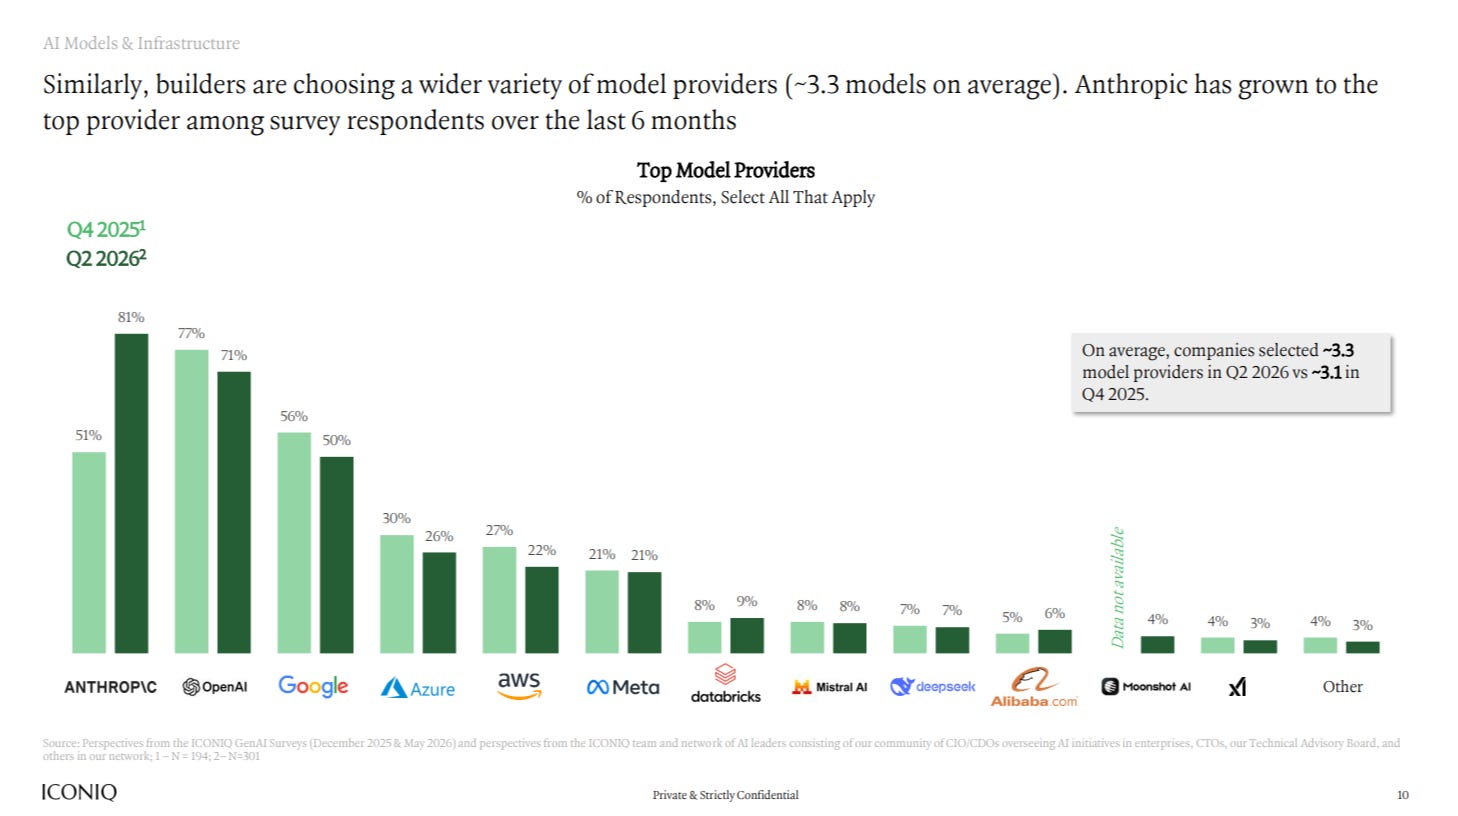
Model share amongst the ICONIQ sample (valuable read through given combination of growth rates and scale):
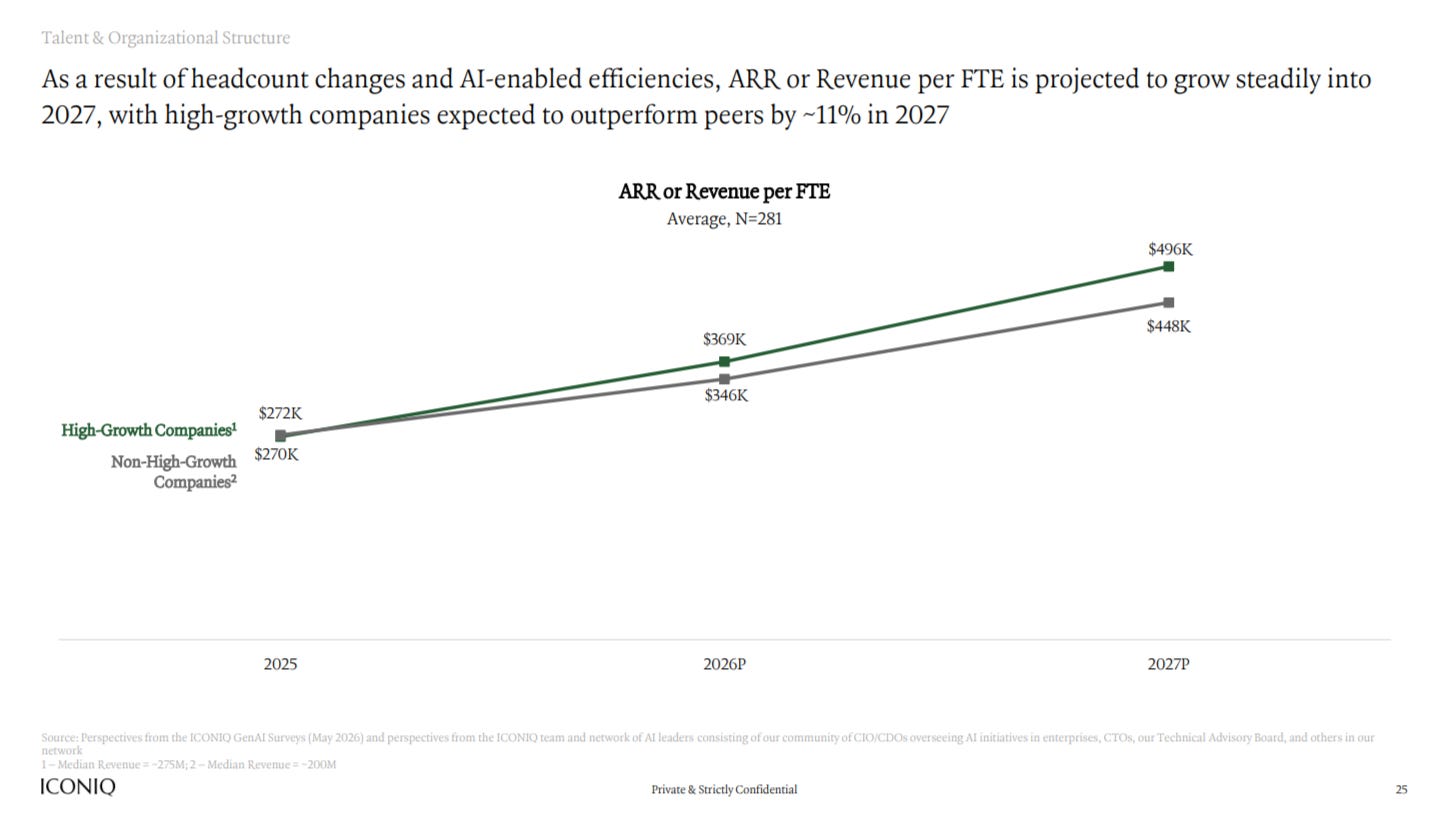
Finally, an update of ARR/employee:
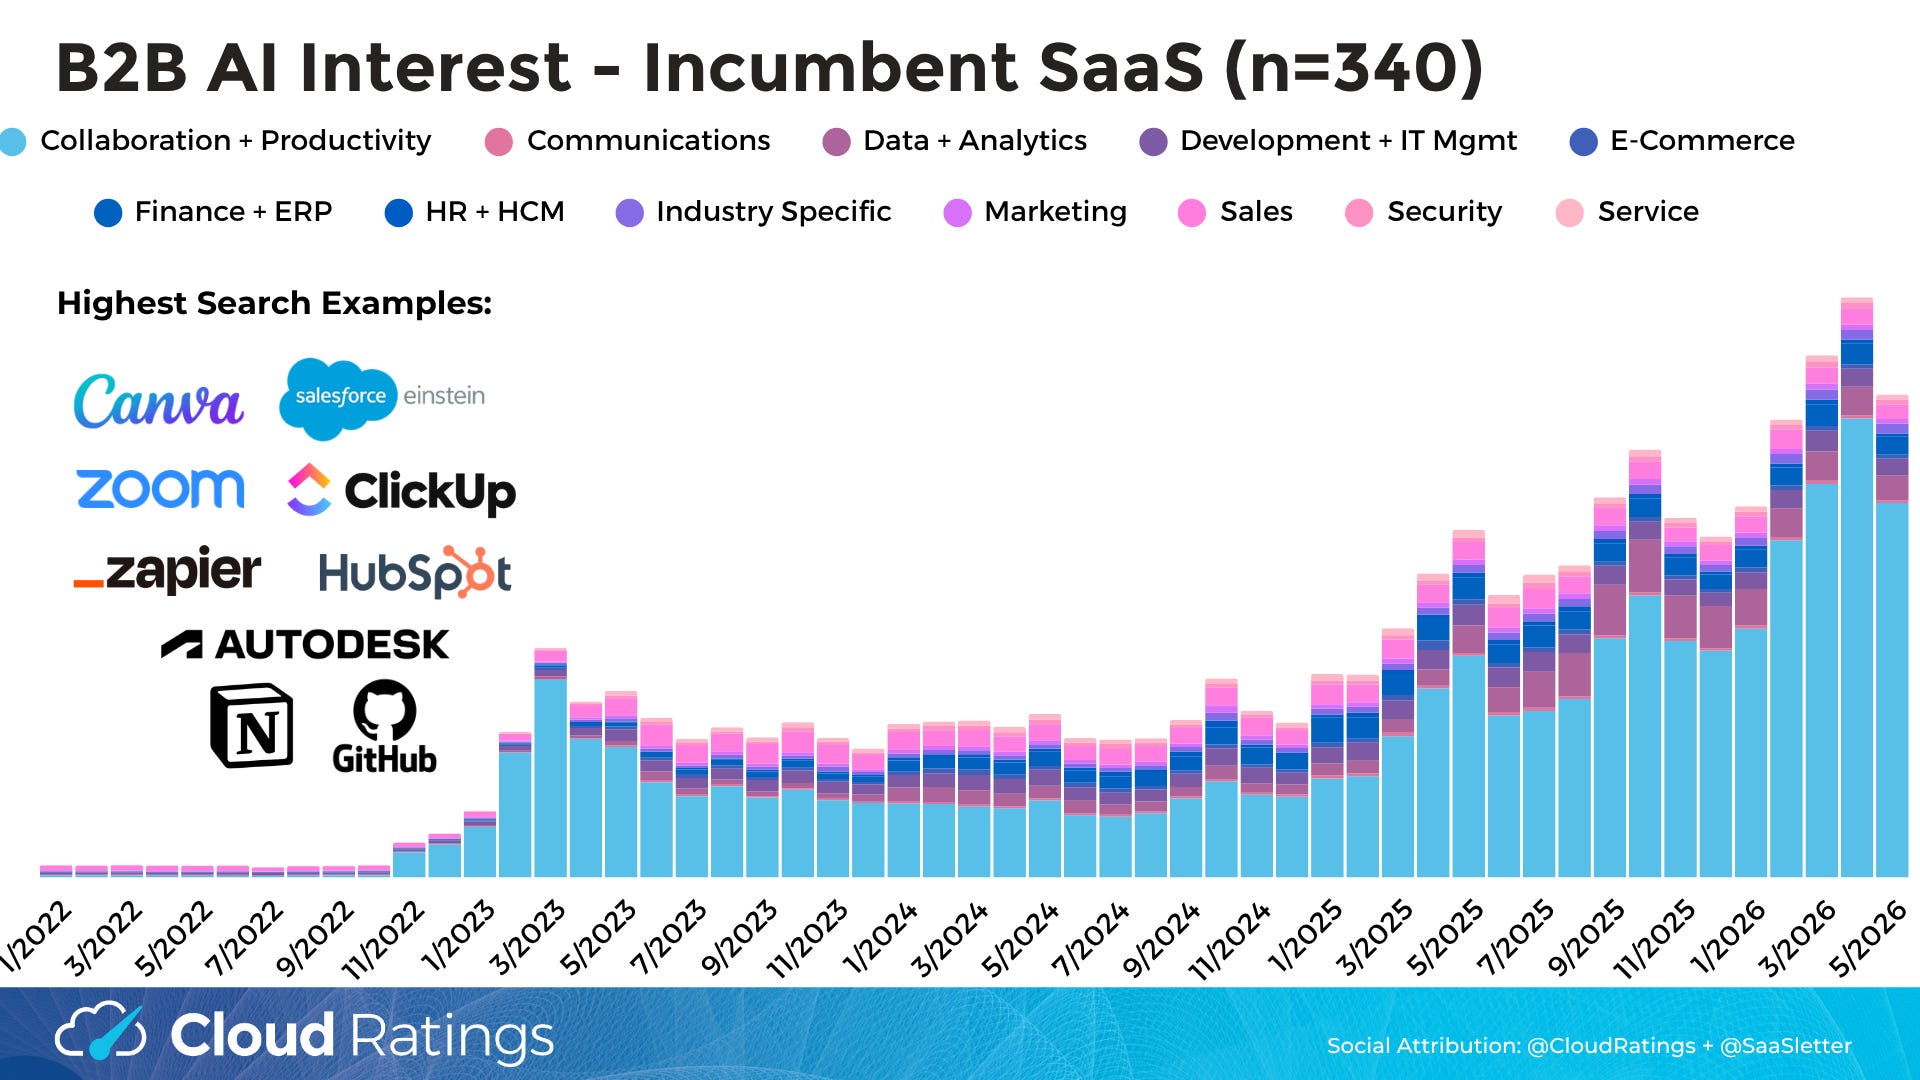
May 2026 B2B AI Interest Index from Cloud Ratings
We’ve updated our Cloud Ratings B2B AI Interest Index through March 2026 - full slides below:
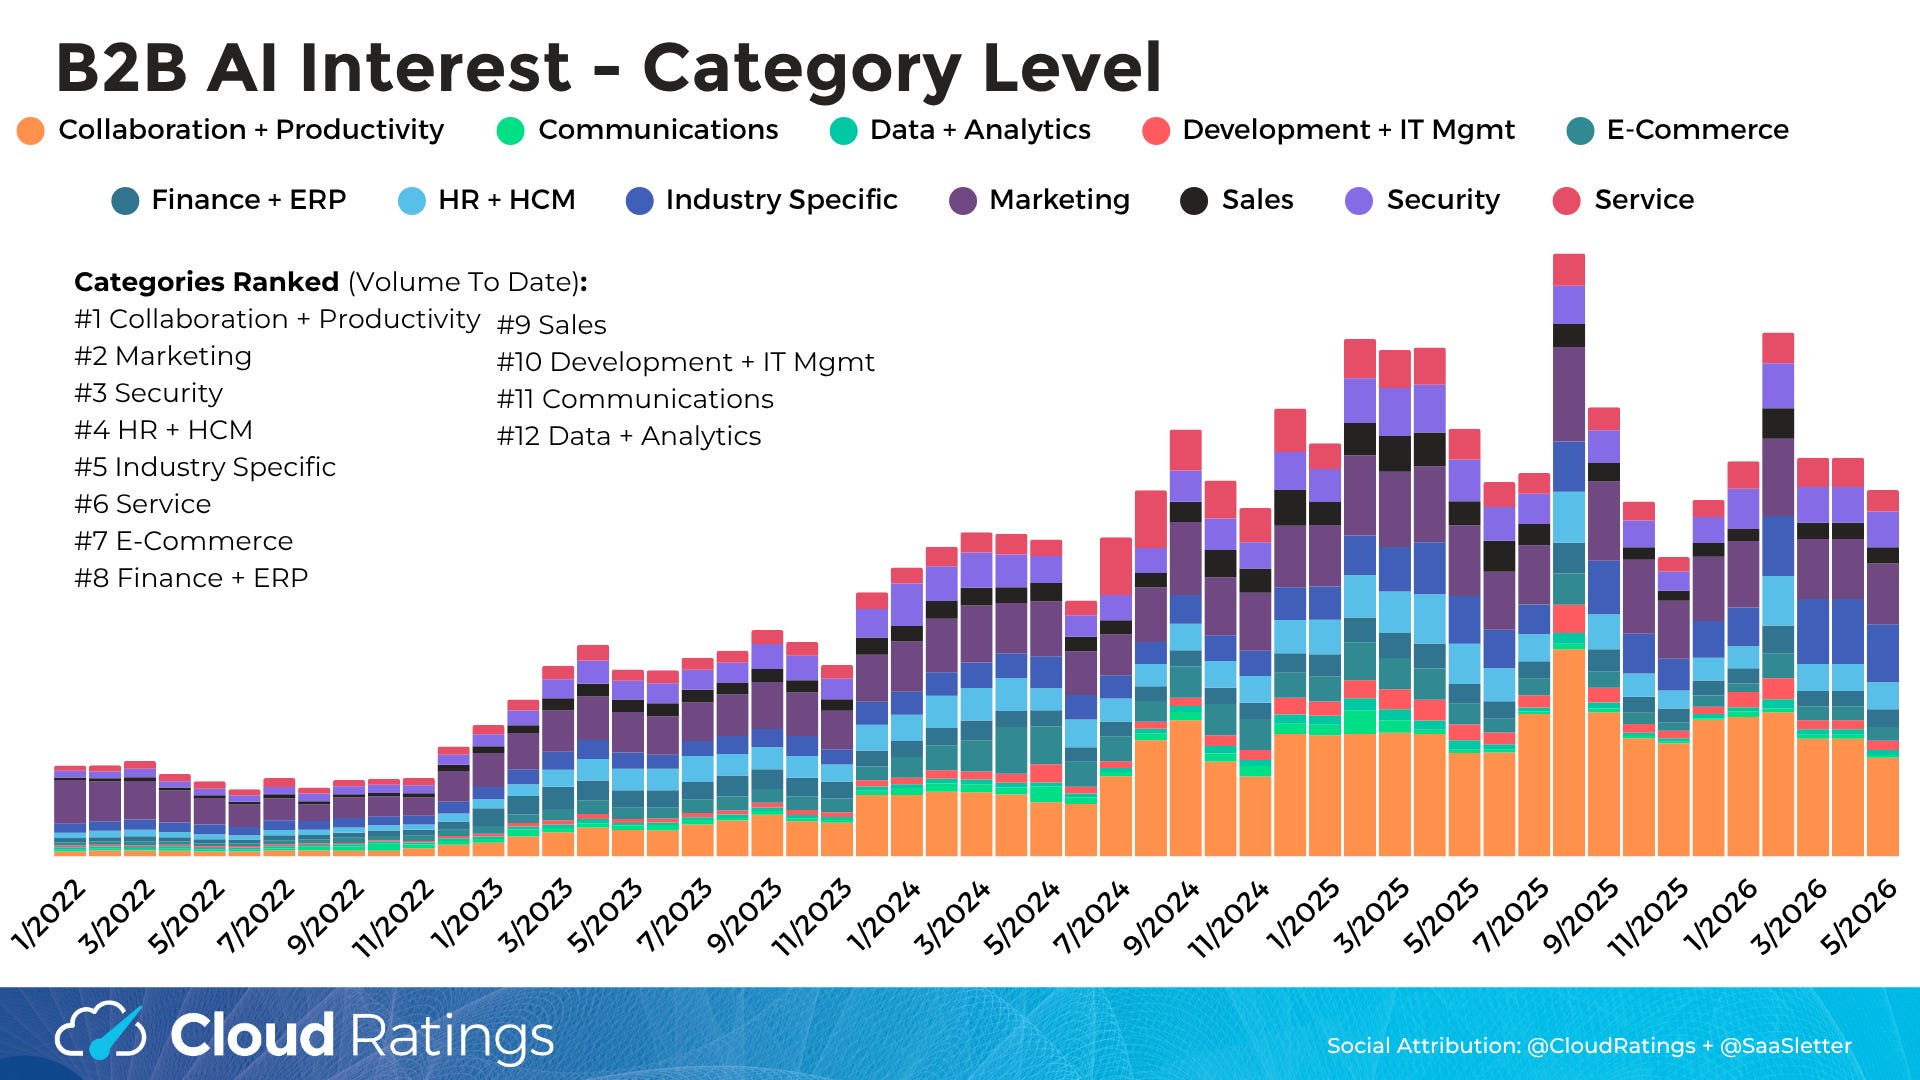
Thematic Category Interest (n = 47 sub-categories tracked - i.e. “manufacturing AI” or “supply chain AI”) continues its plateau pattern.
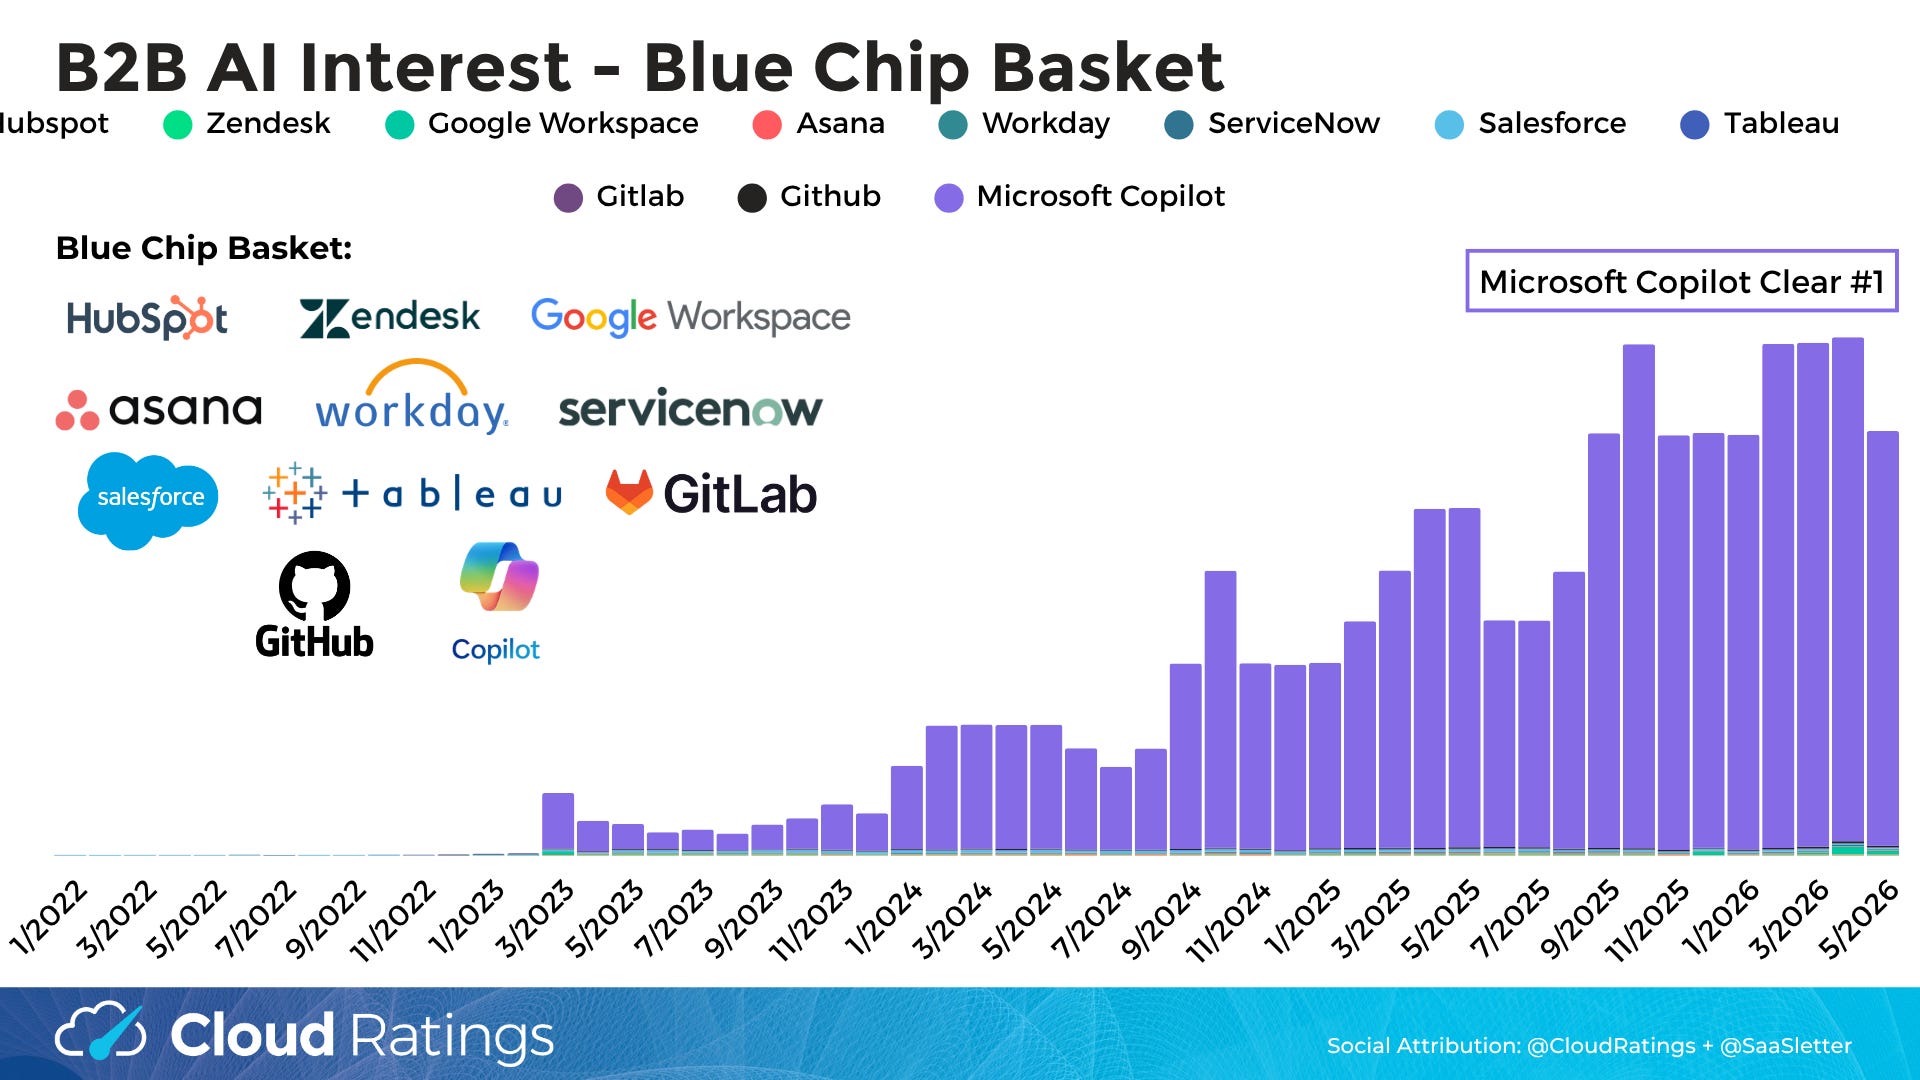
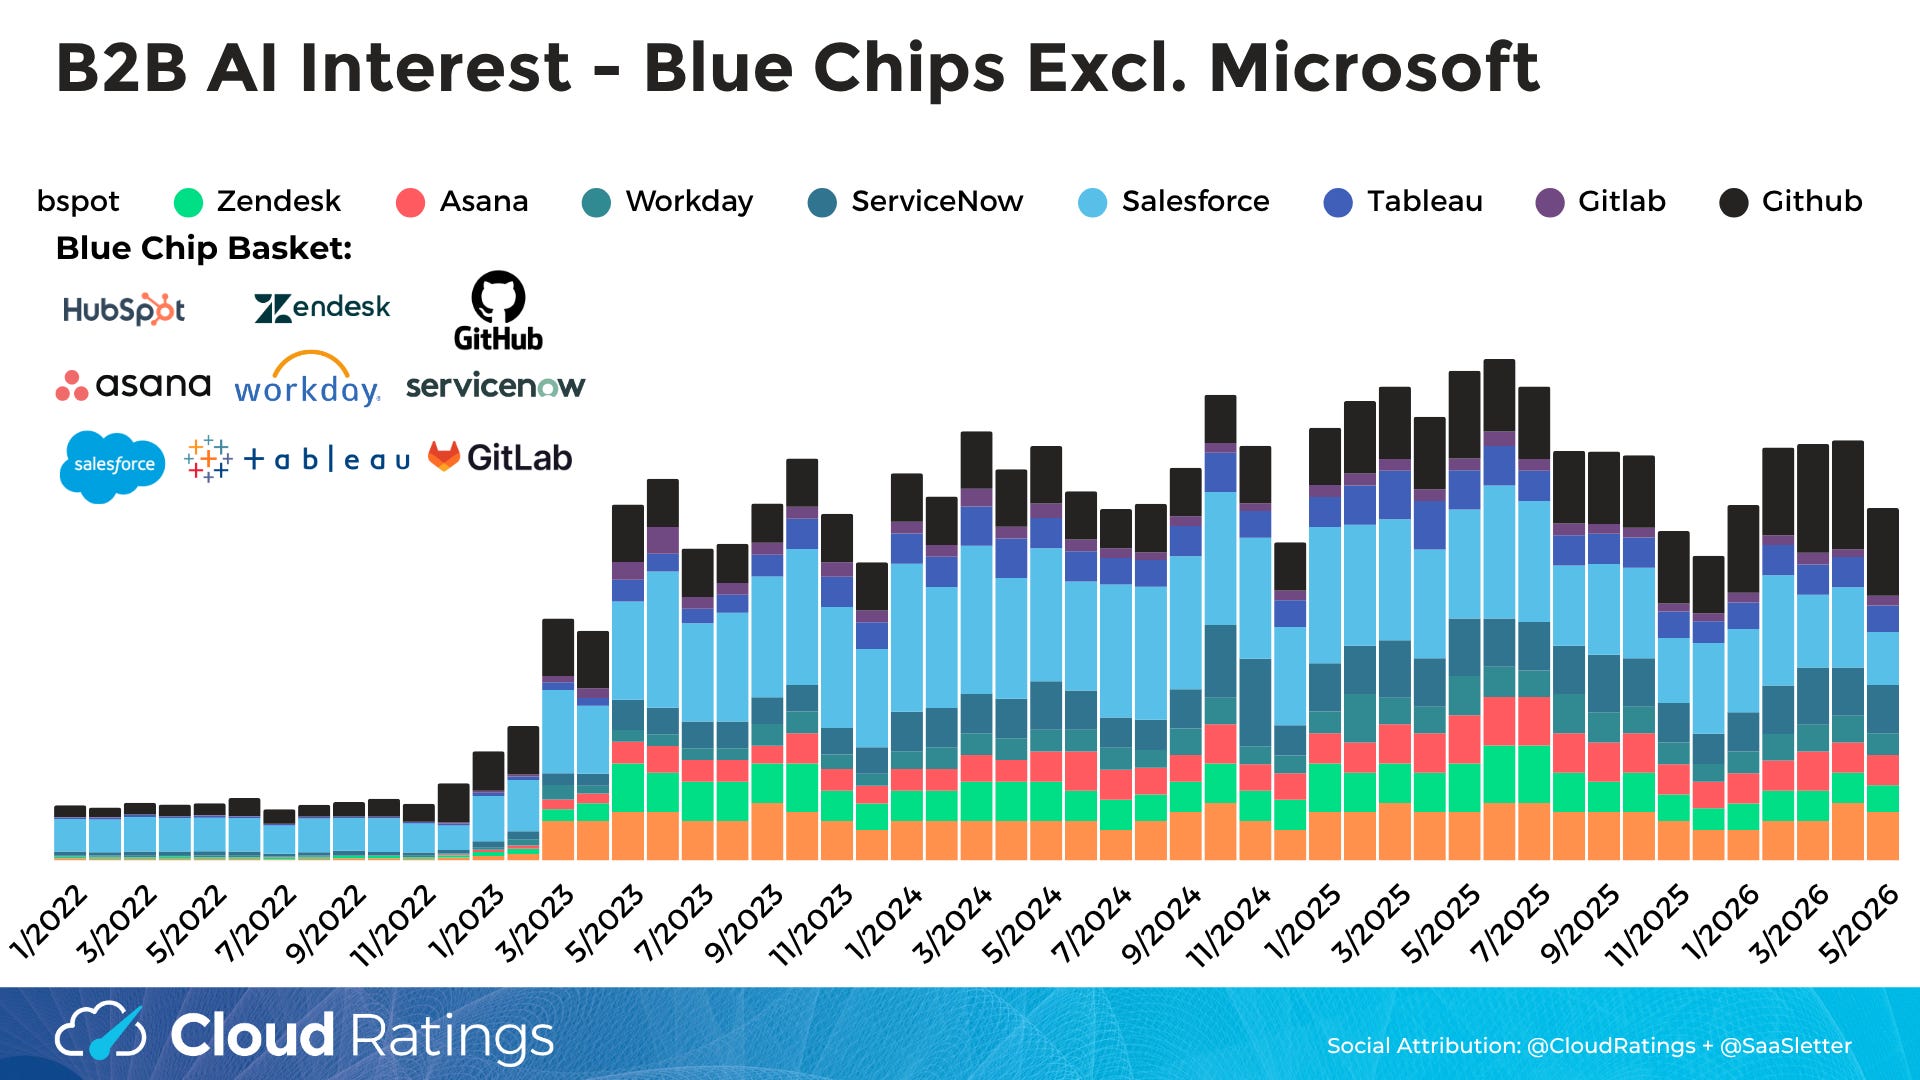
Bellwether Microsoft Copilot continues to stay at a higher plateau. Other “Blue Chips” (i.e., Hubspot, ServiceNow) remain range-bound.
SaaS Incumbents (n=340: the same 340 vendors tracked in our top-of-the-funnel-focused, forward-looking SaaS Demand Index) showed some moderation, but remained on a still-positive overall trendline.
Curated Content
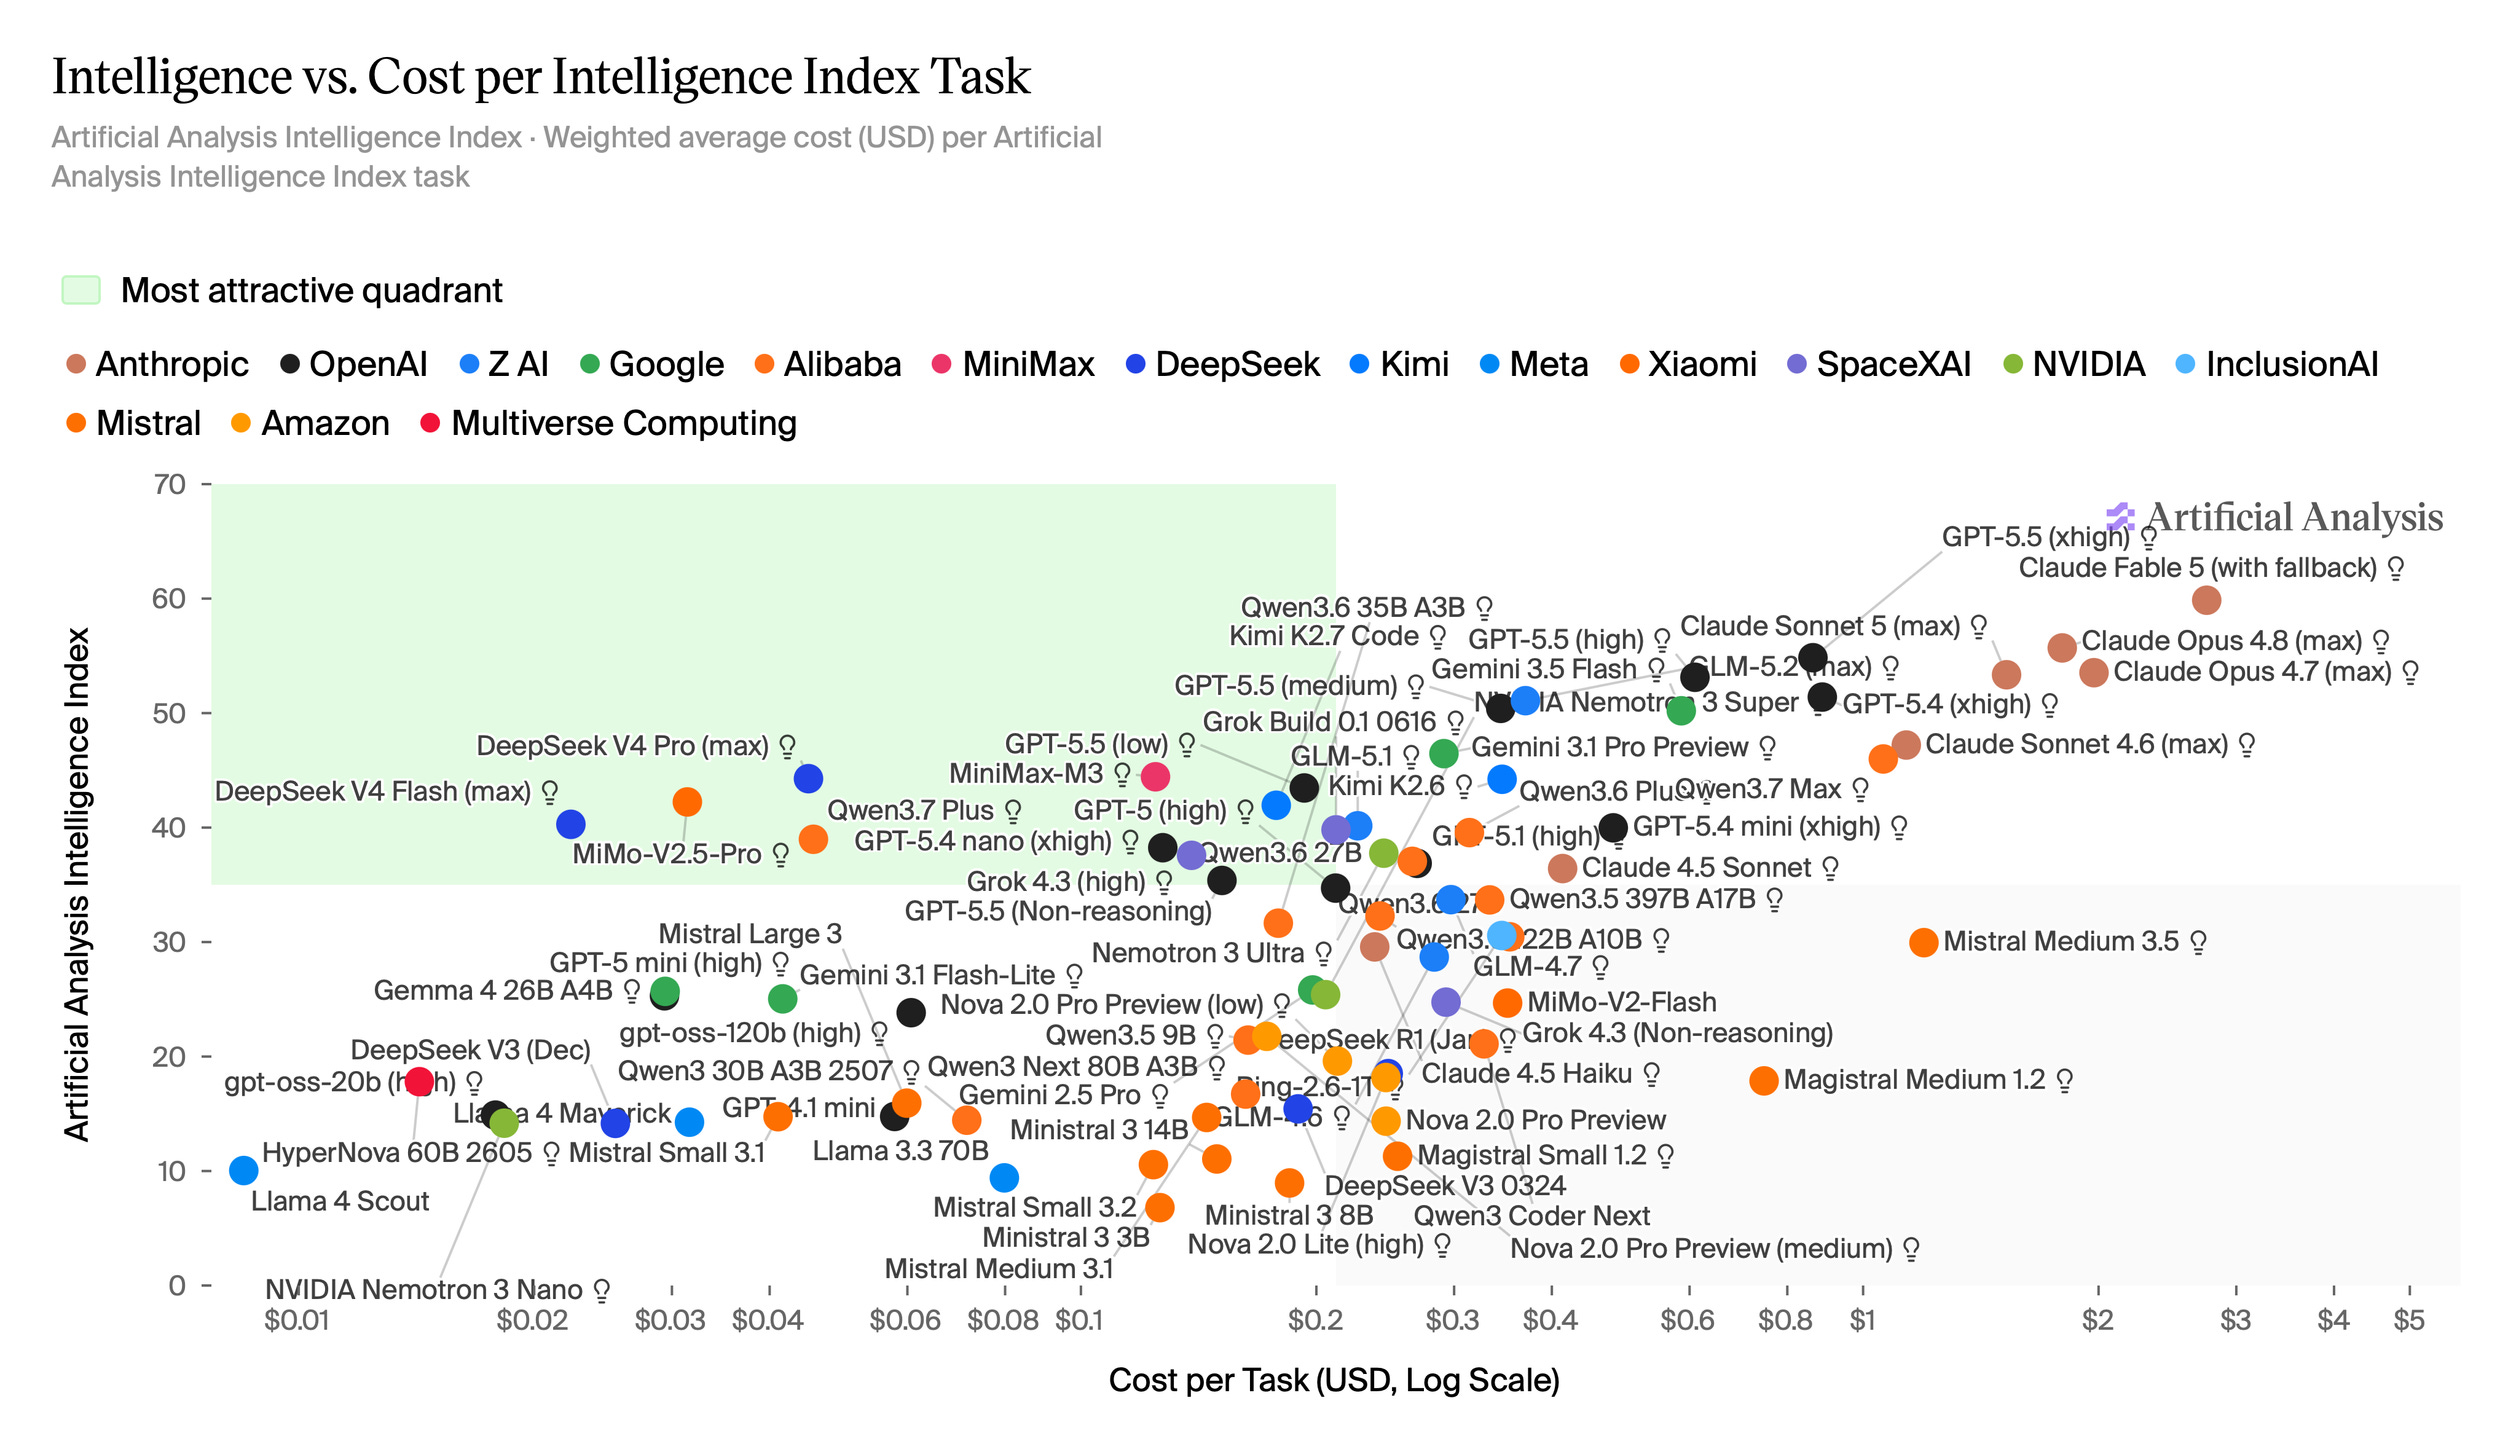
“Ways to think about token pricing” from Benedict Evans
“2026 Midyear Review – 10 Questions Shaping AI (Part 1)” (30 slides, ungated) from Sapphire Ventures (h/t Kevin Burke)
“Work-Bench AI Snapshot H1 2026” (54 slides, ungated) from Work-Bench (h/t Kelley Mak + Proby Shandilya)
About Cloud Ratings
In mid-2024, we announced a research partnership with G2 - more here:

with this slide showing how our G2-enhanced Quadrants (like our recent Sales Compensation Software) release, this business of software newsletter you are reading, our podcasts, and our True ROI practice area all fit within our modern analyst firm:
