
SaaSletter - Sales Check Engine Light
Plus Our June 2024 SaaS Demand Index + Employment Index Editions

H1 2024 B2B Sales Benchmarks → Check Your Sales Engine
The prior edition of the Ebsta + Pavilion B2B Sales Benchmark report was so good that we recorded a deep-dive podcast episode with Guy Rubin, Founder + CEO of Ebsta.
The H1 2024 B2B Sales Benchmark report update is awesome and now covers $57 billion of revenue across 4.7 million opportunities. 4 example slides here:

As the “tip of the spear,” the Sales function provides the clearest view of the state of software. I used long-term data from The Bridge Group to show symptoms of a “maturing growth industry” (more in my slides from Bowery Capital’s Annual Meeting):
For SDRs: outbound efforts have increased… while quality conversations have declined
For AEs: Declining quota attainment speaks for itself. Arguably, lengthening ramp time (63% at 5+ months, up from 17%) is equally insightful → if buyer demand and TAMs were really there, a *median* new AE could quickly ramp to satisfy that unmet demand. In a more saturated market, AEs are forced to create demand (which is often fake - more on this later).

The Ebsta + Pavilion top rep outperformance metric deserves to be a third check engine light alongside quota attainment and ramp times:

The alarming facts:
Top sellers are now 10.2x more productive than their peers, up from 4x in 2022
16% of reps generate 83% of revenue
While this model can work at times:
if teamwide quota attainment was healthy (i.e. 70%), a 10.2x top rep delta would actually be a great sign → mathematically, you would be crushing your plan
Datadog (DDOG): posting healthy growth despite quota attainment in the mid-20s per RepVue
AppFolio (APPF): per RepVue seller reviews, “leadership has restructured quotas for a target of 25% attainment"
… a 10.2x seller delta is unsustainable relative to what is “priced in” for the software industry (i.e. high revenue multiples; underwritable long-term growth).
As an analogy, a business with a customer concentration of 16% customers at 83% revenue would trade at a discounted multiple.
An investment in a software company is really an investment in a new customer acquisition machine.
Per Morgan Stanley’s X-Ray methodology, future customers represent 44% of the average public company enterprise value and ~80%+ for certain companies (like Hubspot, Samsara, and Cloudflare). For early-stage venture-backed companies, nearly all of the value (~95%+) is in future customers - there simply is no valuation / FCF support from the installed base.
If only 16% of the sales force can generate real revenue, surely the customer acquisition machine is wearing out, with check engine lights flashing. Surely, the TAM is getting saturated, making underwriting high future growth very hard.
More H1 2024 B2B Sales Benchmarks Highlights
We covered a “holding onto fake deals” dynamic in our earlier podcast with Guy Rubin (clip here):
I think the reality is that there's a lot of opportunities that the average performers are still leaning into and spending time on that aren't real. They were never real.
It's not that they lost them. It's just that they were never in a sales process in the first place.
Just because you got off a call with a prospect who might have in came inbound and put their hand up and said I'd like to know more about what you're doing, that doesn't necessarily mean that they've got a budget, there's a definitive timeline they're working to and they they're the economic buyers and all the other key data points that we need to understand.
The H1 2024 report again captures that dynamic.
Top performers disqualify earlier:

… and low performers’ (fake?) deals break down in late stages, often due to ROI (“Win rates decrease -64% when ROI is discussed late stage” - more on this in our “Too Little Value Selling” note).
Perhaps this next stat deserves to be a fourth check engine light: 18% of 2024 pipeline matches the business's ideal client profile (ICP).
18%! The growth in the non-ICP pipeline is consistent with the “fake deals” trend.

As always, go read the full report.
June Demand Index
We’re excited to update the SaaS Demand Index with data through June 2024.
For our new readers: the Demand Index is derived from high-intent Google Search volume data. Due to a partial shift in Google’s methodology, this month’s sample consists of 177 companies and 180,000+ searches (versus our usual 340-company universe). However, all graphs are pro forma on a historical basis (i.e. apples to apples).
Slides here:
Reminder: this is a directional, free, and ever-evolving* analysis → always do your own due diligence.
Moreover, the data captured here is best characterized as top-of-funnel or dark funnel → factoring in sales cycle length, do NOT use this Demand Index as a predictor of near-term financial results and/or financial guidance.
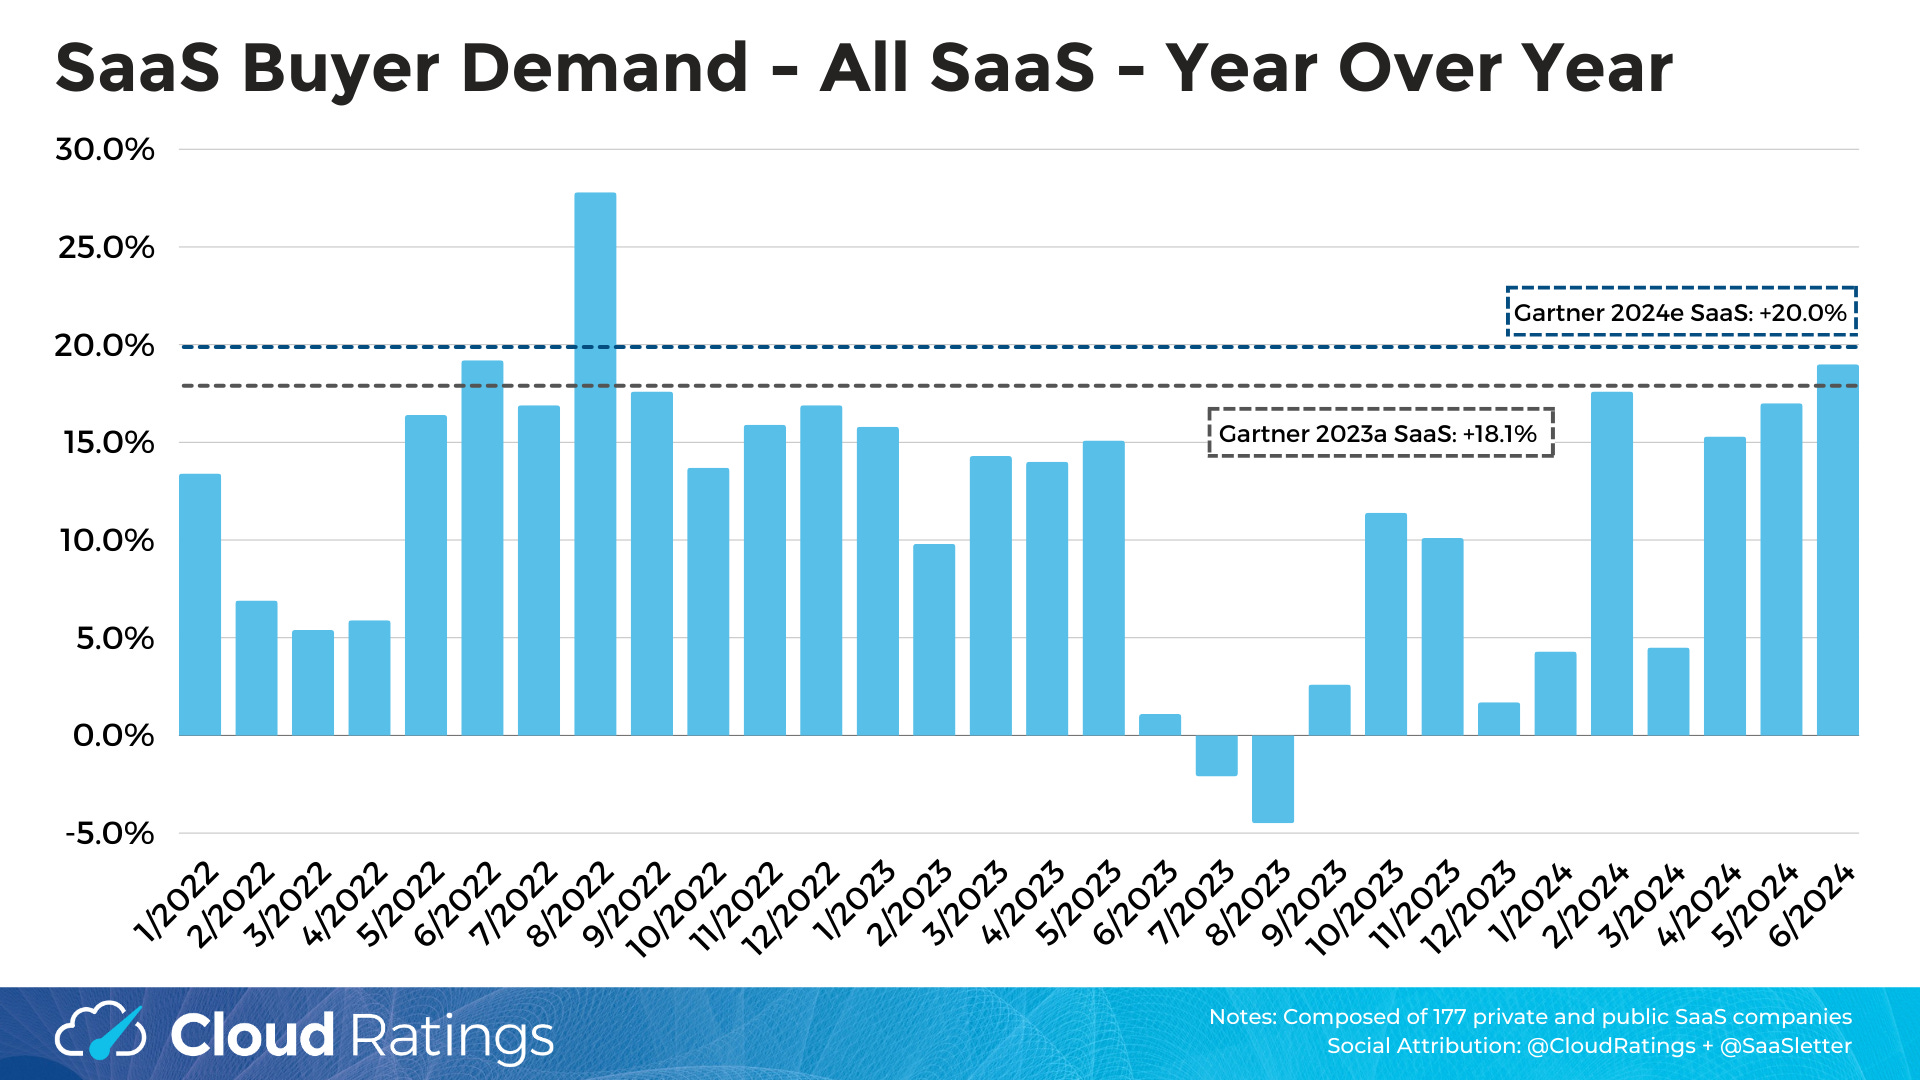
Industry-Wide Data
High-intent search volumes were up +19% year-over-year and -1% month-over-month. Said differently, June was 4% below the March 2024 peak.

The new YoY graph below compares the high-intent search trends to Gartner’s 2024 cloud spending forecast only to give context. In the footnotes, we note possible “apples versus oranges” dynamics when comparing the SaaS Demand Index versus Gartner.**
Trends By Product Category
This slide presents growth for the last month and last three months, respectively:

Callouts from recent trends:
Above Average Performers: Consistent with prior months, the strong performers were Security, Communications (still attributable to certain pricing actions), Industry Specific / Vertical, HR + HCM, Sales, and Finance + ERP (see our earlier “Office Of The CFO Software Surge” note enhanced with G2 adoption data).
June SaaS Employment Index

As a reminder, our SaaS Employment Index covers employment trends for 3,500+ private US HQ’ed software companies. Slides for this month are available here:
*To publish closest to month end, we are accessing the underlying API data “early” (relative to the typical SEO and PPC users that do not require such immediacy). Therefore data should be considered “provisional” (i.e. subject to revision by our data provider) and create volatility in the data presented in the 2 most recent months.
**Demand Index vs Gartner SaaS Revenue possible “apples versus oranges” dynamics:
potential buying journey shifts away from Google search and now starting on review platforms (like G2) and - to a lesser extent in terms of measurable impact - community recommendations (like private executive Slack groups).
a general trend for Google search volumes to plateau with scale. We’ve also observed this dynamic with retailers.
most importantly, the SaaS Demand Index is a *forward indicator*, whereas Gartner’s market sizing and growth capture *realized revenue* → given sales cycles, “lagging” our SaaS Demand Index is the right way to examine correlation.
This report was first published on cloudratings.com.