
SaaSletter - Benchmarkit / Emergence 2025 SaaS Benchmarks
Framing Benchmarkit's latest with data since 2010

Benchmarkit and Emergence Capital recently released their 2025 SaaS Benchmark report (n=563).
SaaS Benchmark Historical Context
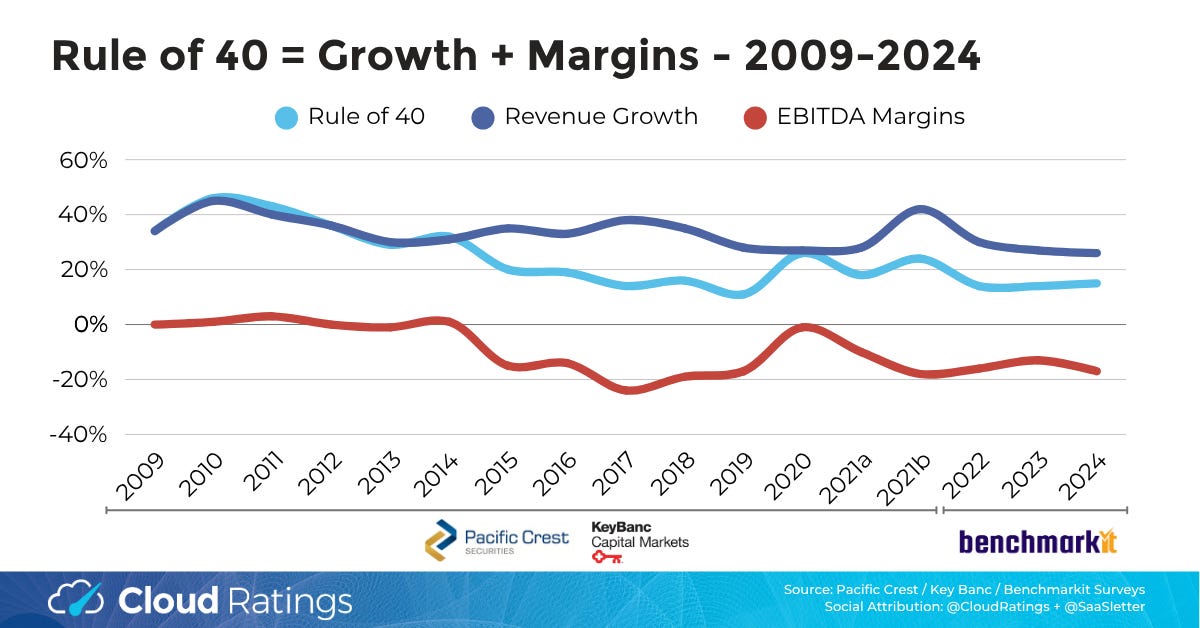
Earlier we constructed a set of historical SaaS benchmarks by aggregating Pacific Crest and KeyBanc’s reports1:

We’ve updated our data set and slides to incorporate data from the newest Benchmarkit report.
My prior headline take seems to hold: “A Maturing Growth Industry: The historical SaaS benchmarks capture the maturation of the industry. That said, a 33% average revenue growth rate is a material offset to “only” mid-single digit (MSD) CAGR metric declines.”
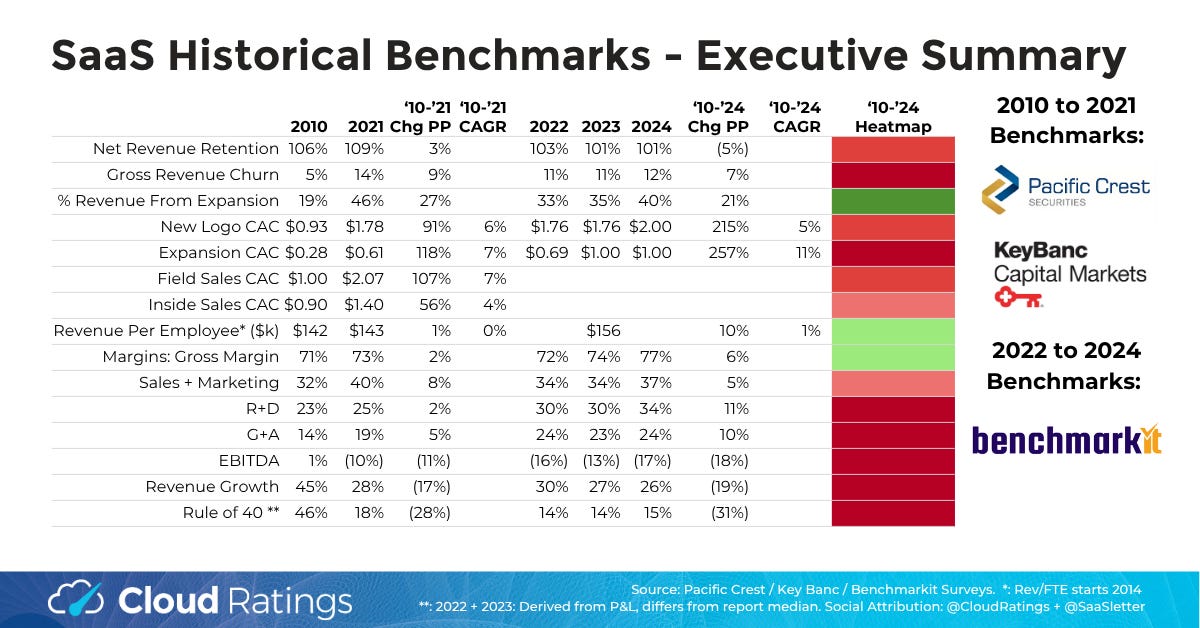
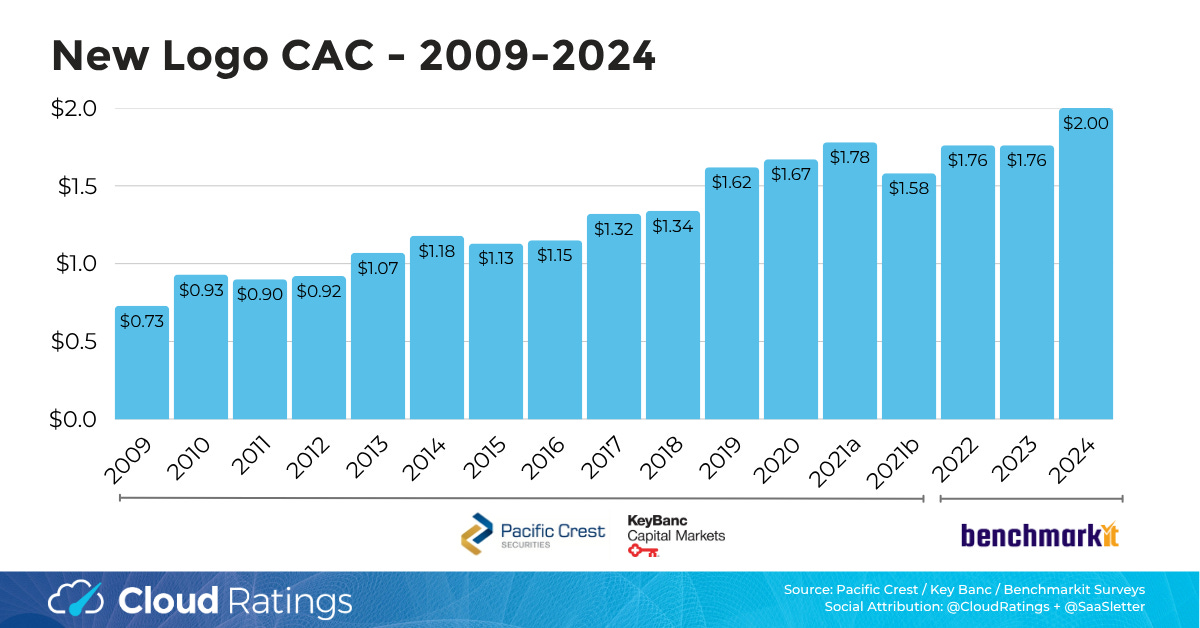
Much of the deep red on the 2024 versus 2010 heat map can be explained by an easy comp in 2010 from when the SaaS industry was less competitive, especially evident in CACs (New at $0.93 and Expansion at $0.28)
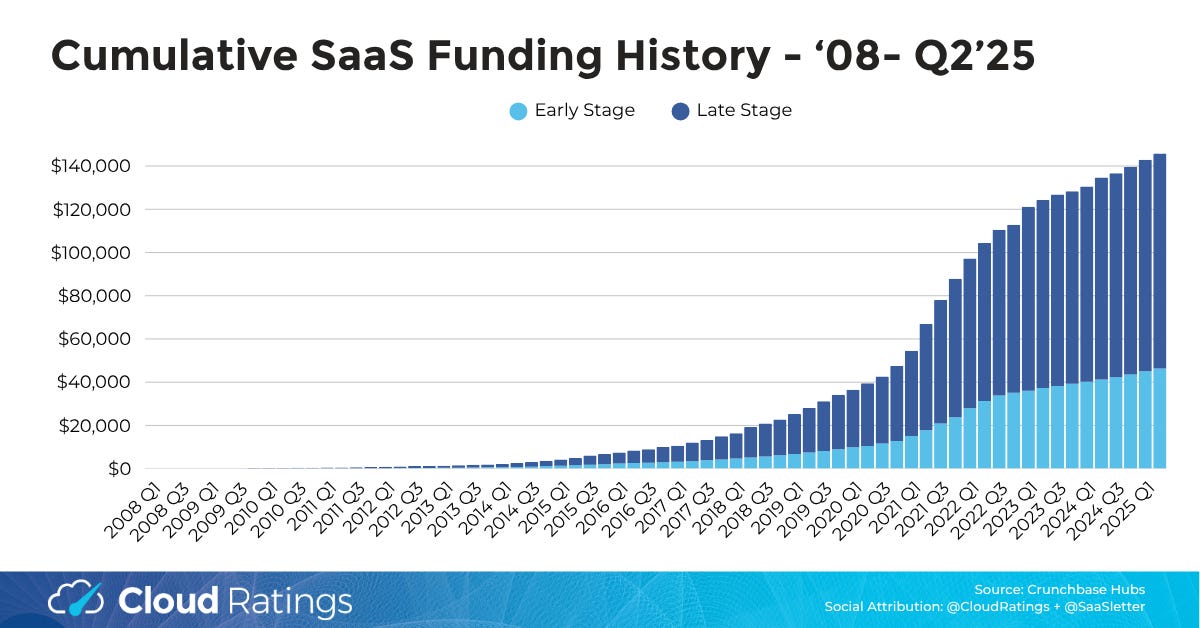
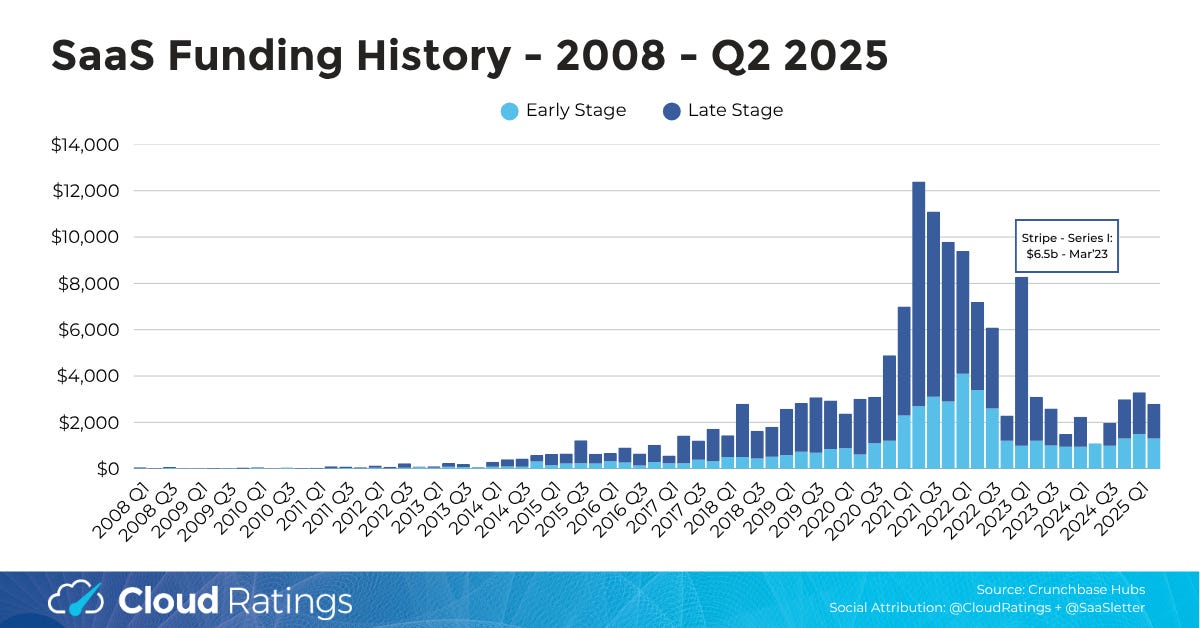
The truly outsized IRRs at those CACs have literally been competed away as a tsunami of capital sought out those outsized returns. The capital deployed in the early era of SaaS barely registers when graphed:
2025 Benchmark Call-Outs
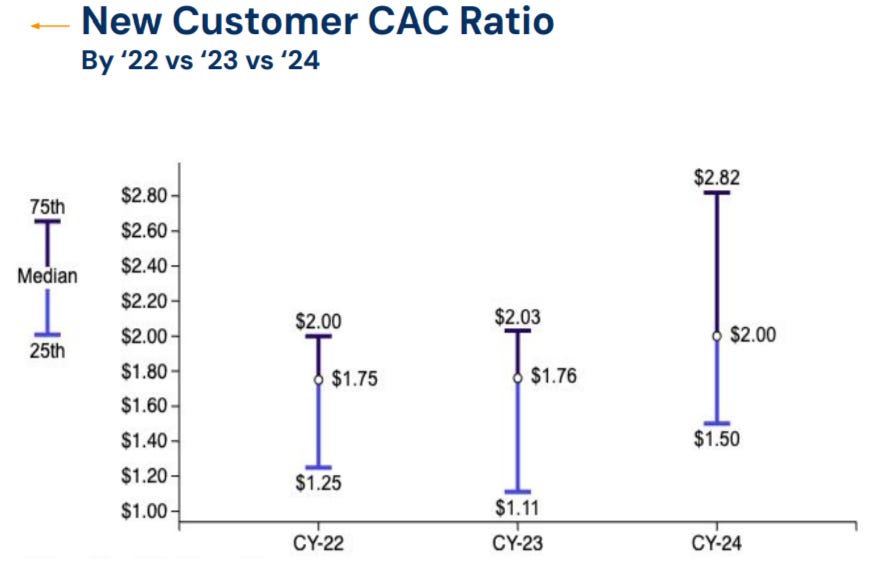
New CACs rose to $2.00 (+14% YoY), with the bottom quartile at an alarming $2.82 (+39% YoY). Broader historical context here:
Given the unacceptable state of forecasting in software:
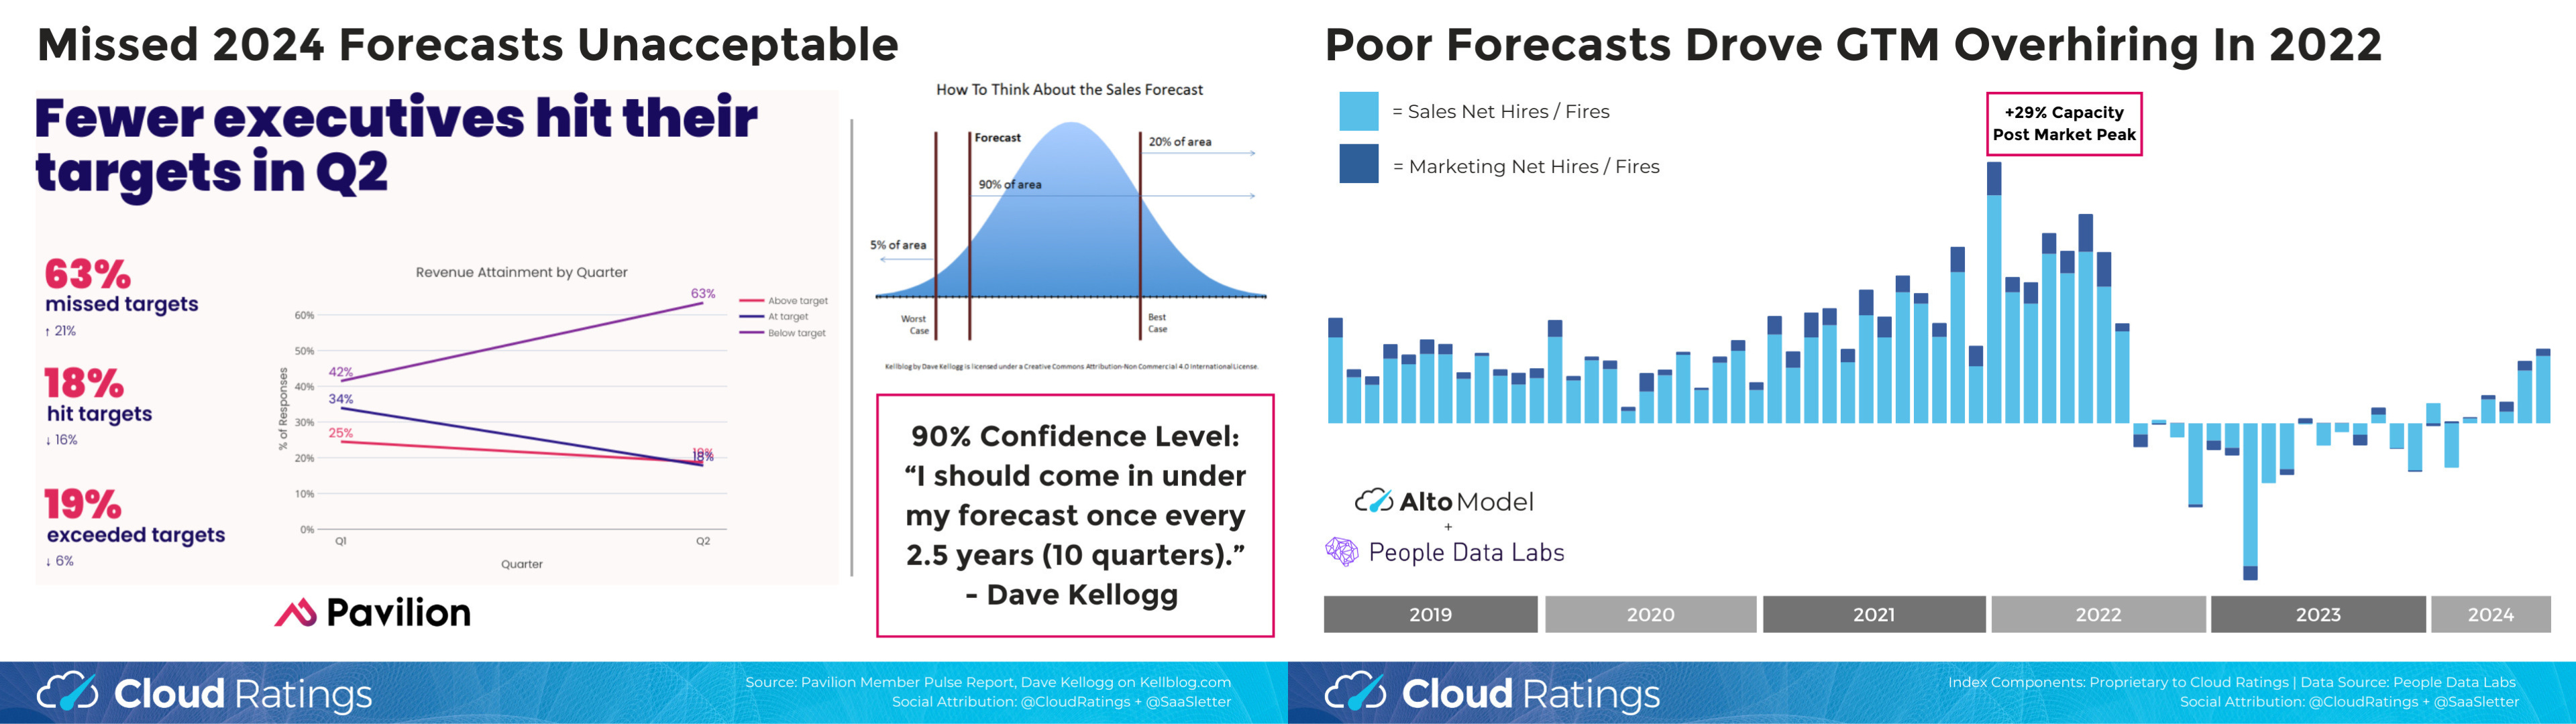
We will cover advanced tactics for improving your forecasts in a July virtual summit with Ebsta, G2, and People Data Labs
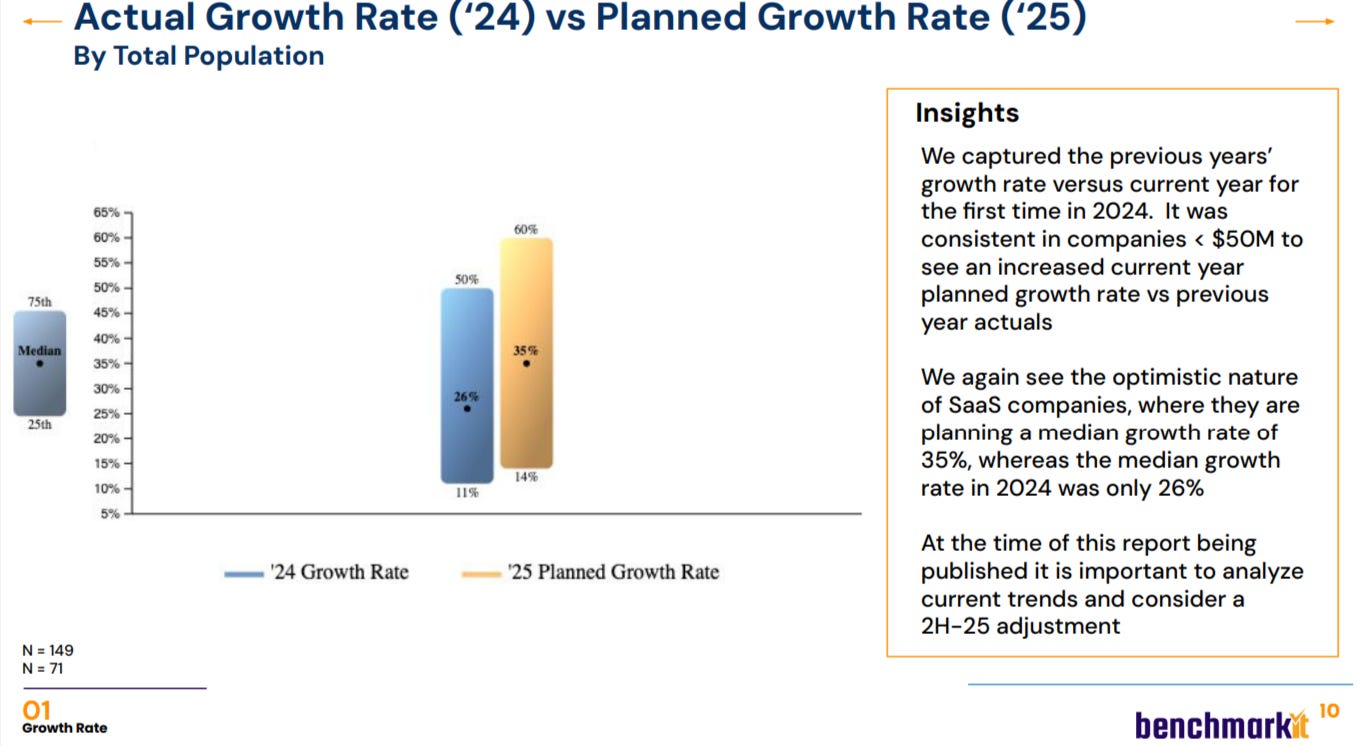
… this planned acceleration (2024 revenue growth 26% → 35% 2025 forecast) was notable and at risk (unless AI uplift is that strong)
A Maturing Growth Industry: More Indicators
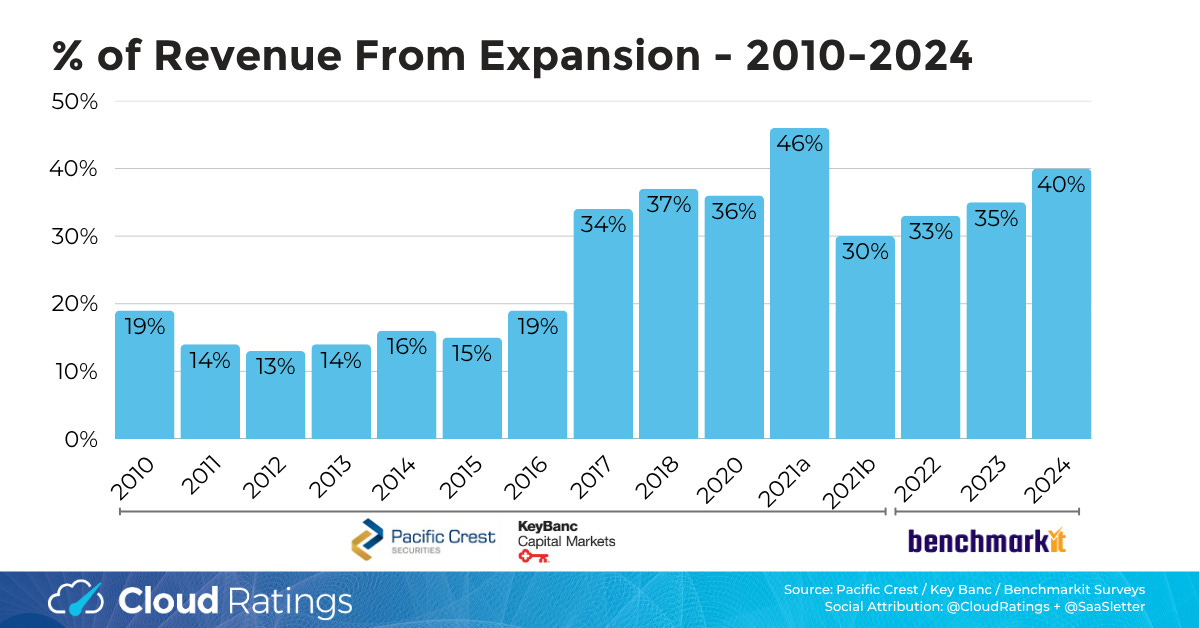
Expansion CAC was stable vs the prior report at $1.00
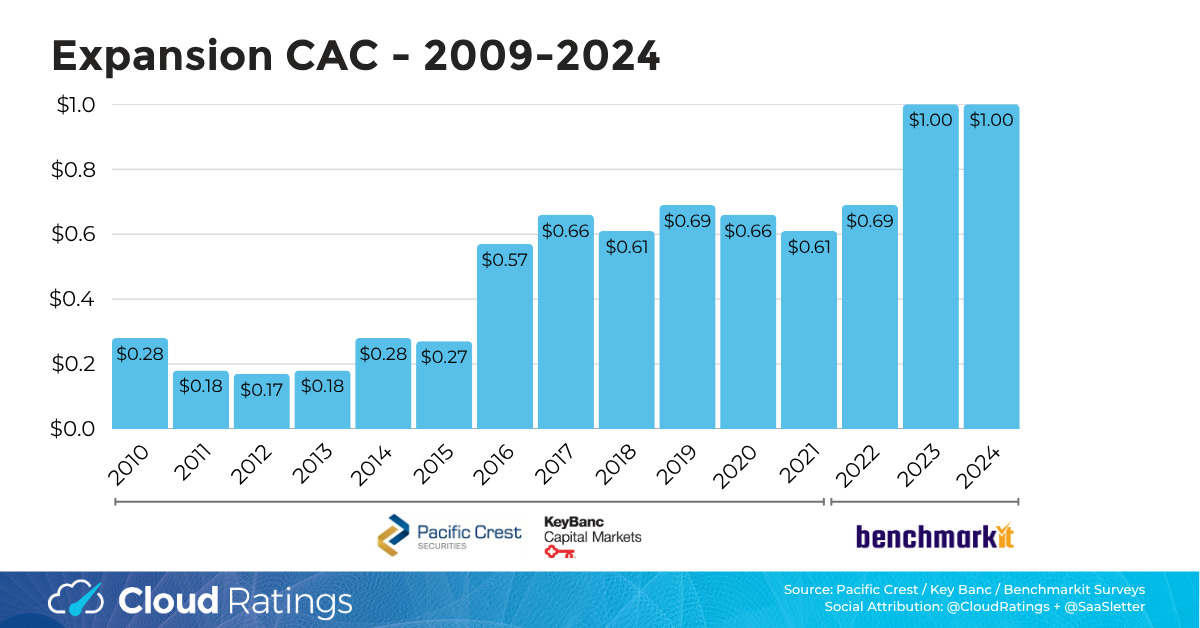
… which is meaningful since Expansion now represents 40% of revenue.
Note: there is a strong “installed base” size effect implicit in this trend line (in the 2010-2011 era, a young industry / company universe had a more limited base to generate expansion $’s from):
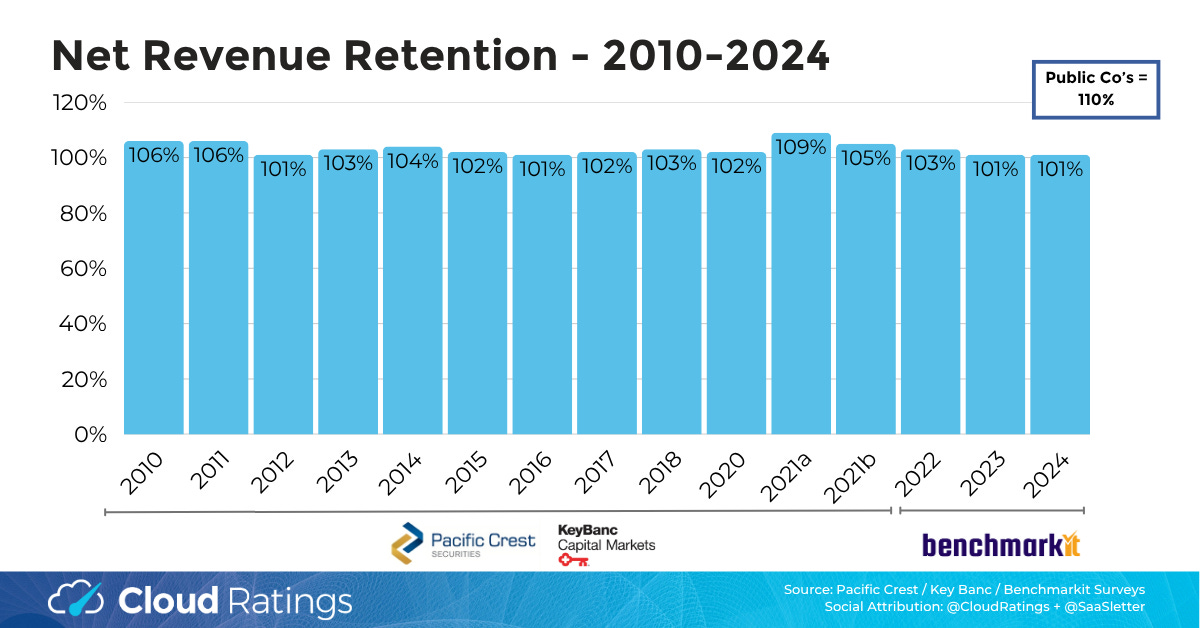
A recurring theme: public companies consistently outperform on Net Revenue Retention (NRR): 110% median (per Meritech’s SaaS comp table) versus 101% in this report:
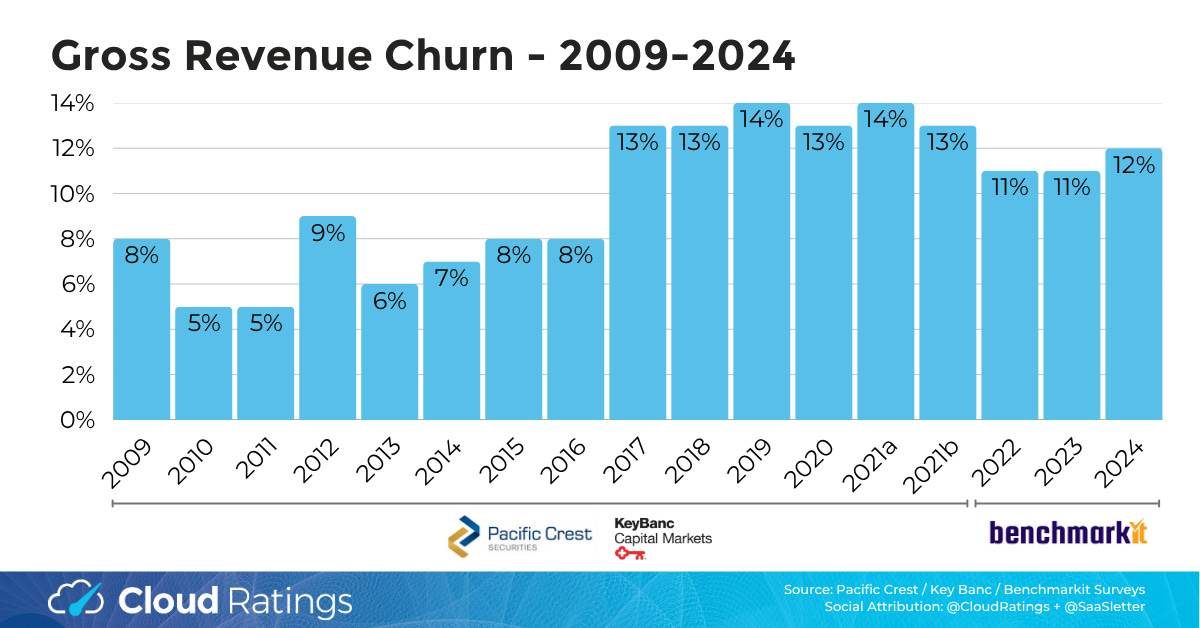
Hopefully, the rest of these graphs speak for themselves:
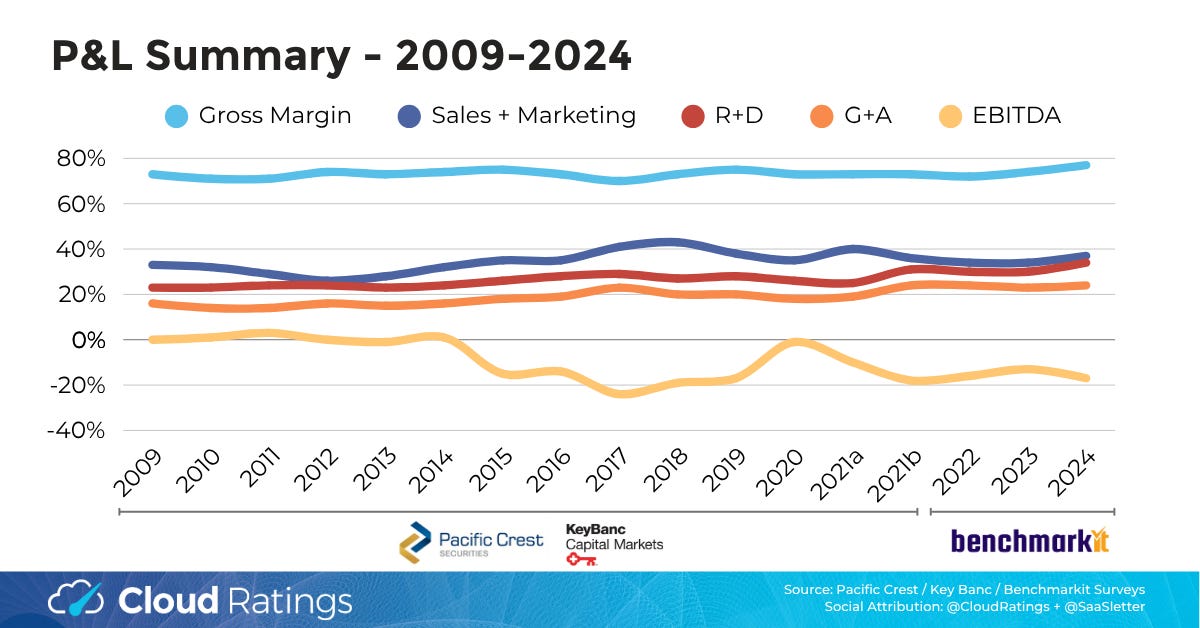
A downloadable copy of our above graphs is available here.
Now Go Read Benchmarkit / Emergence’s Report
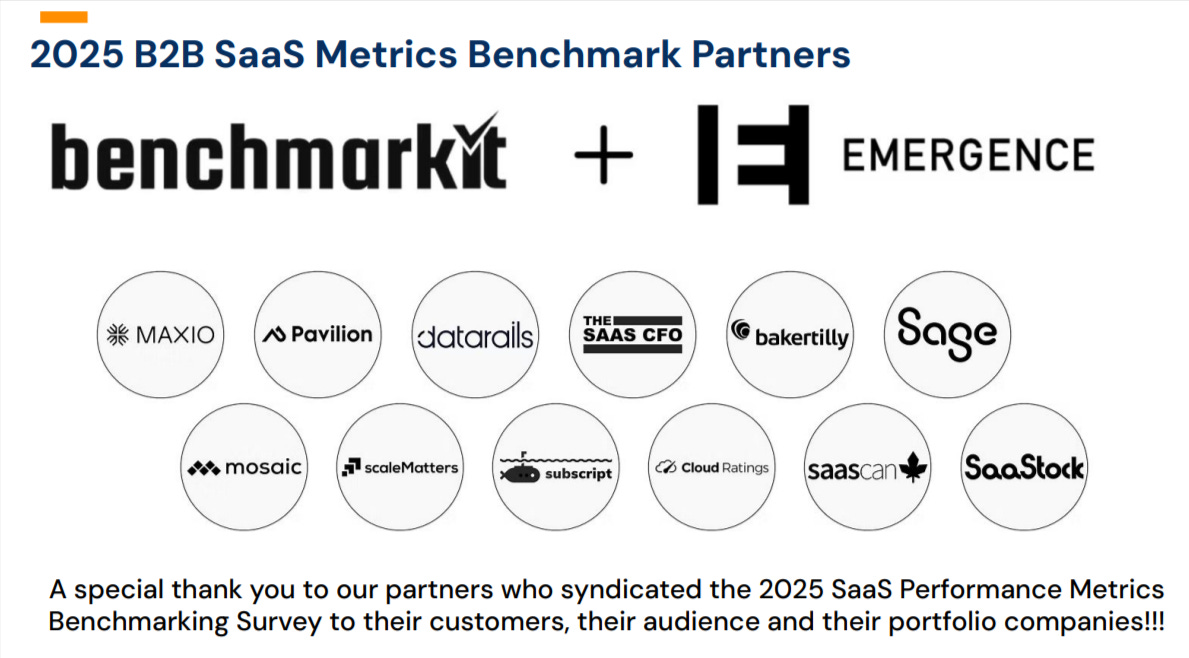
Cloud Ratings and I were proud to support Ray Rike + team’s hard work in driving 563(!) SaaS companies to submit their benchmarks. Again, go read their report:
About Cloud Ratings
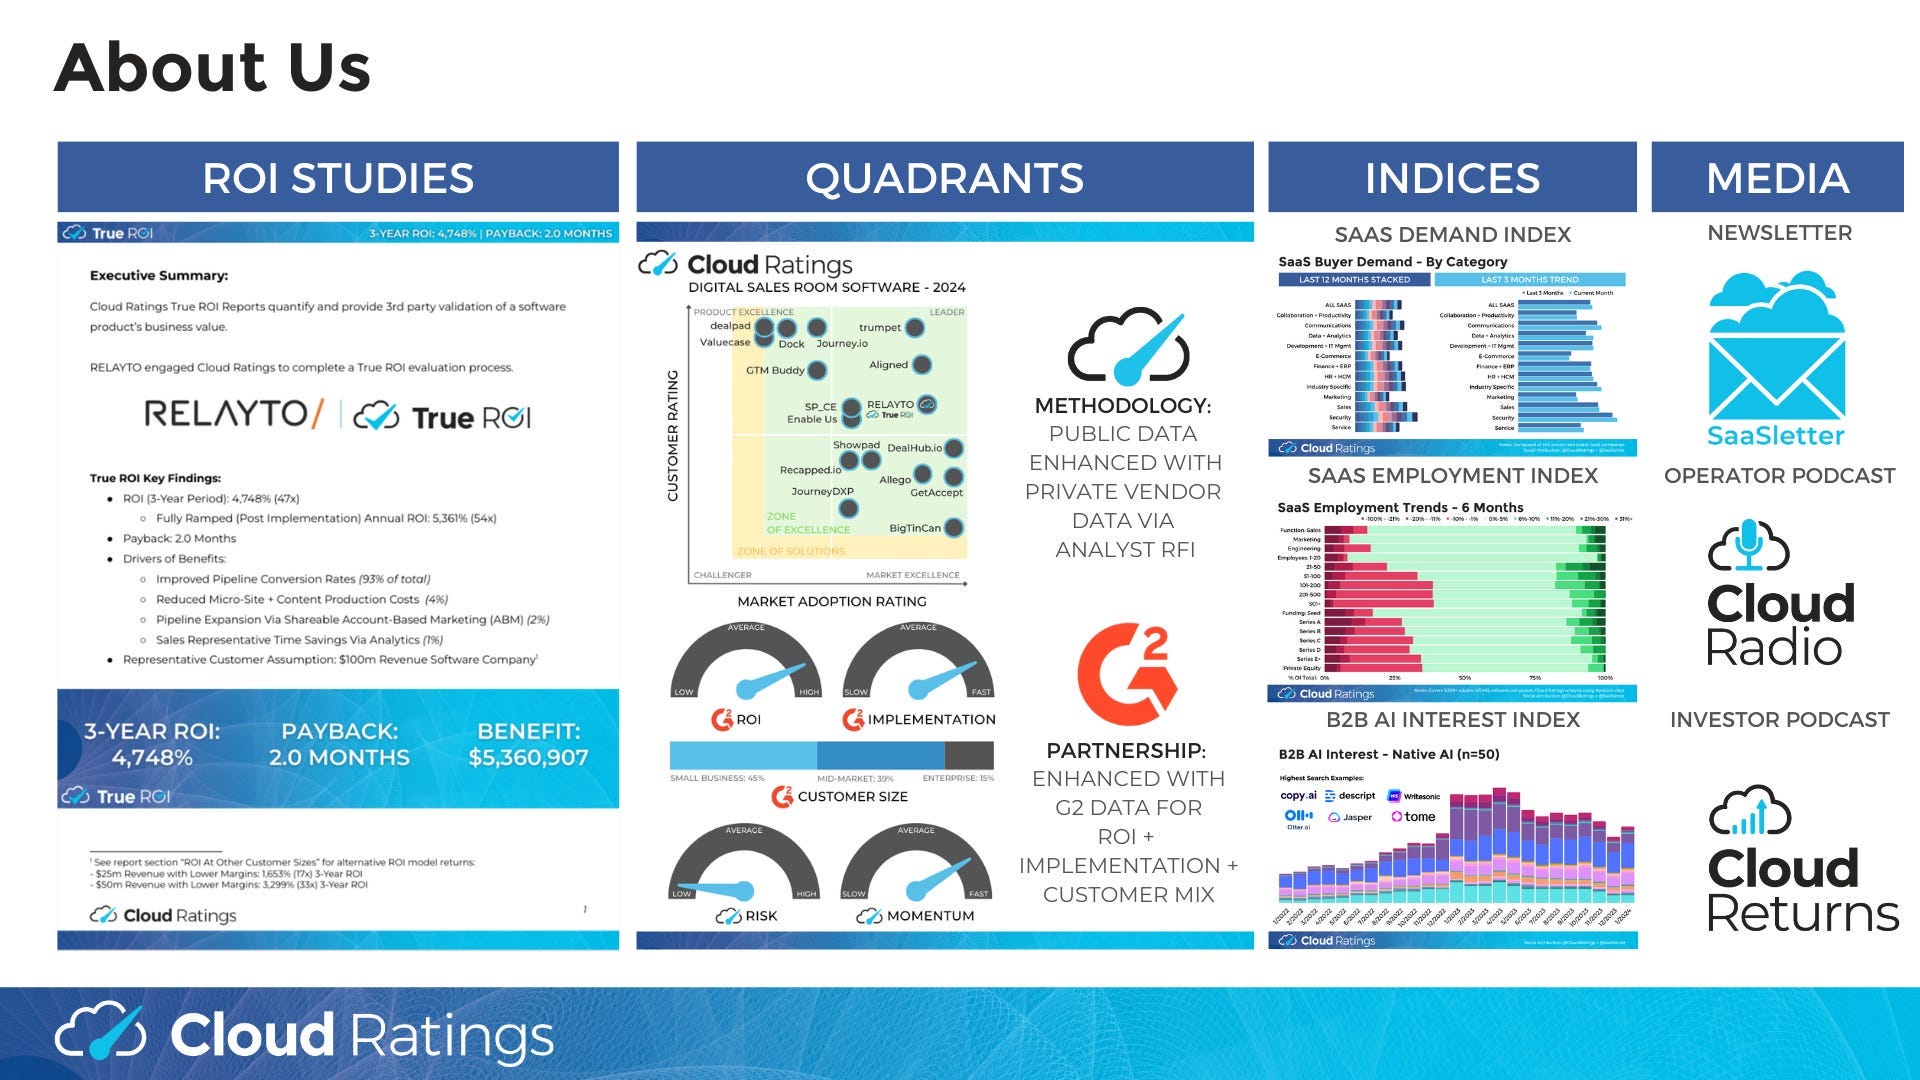
In mid 2024, we announced a research partnership with G2 - more here:

with this slide showing how our G2-enhanced Quadrants (like our recent Sales Compensation Software) release, this business of software newsletter you are reading, our podcasts, and our True ROI practice area all fit within our modern analyst firm:
Note: Key Bank produced multiple reports covering 2021 data. Both reports are reflected in the analysis as “2021a” and “2021b”