
SaaSletter - Benchmarks From KeyBanc / Sapphire + High Alpha
Positive Trends... With Real Forecast Risk

It’s benchmarking season, so modest apologies for the high frequency of our “just in time” newsletter approach:
KeyBanc + Sapphire 2025 SaaS Benchmarks
I’ve been reading this series dating back to the Pacific Crest Securities (before their joining KeyBanc) days. We’ve kept a compilation of the historical KeyBanc SaaS metrics back to 2009 through 2024 to create a long-run time series - our full slides here and write-up version here:

Now onto the new 2025 KeyBanc + Sapphire report (email required).
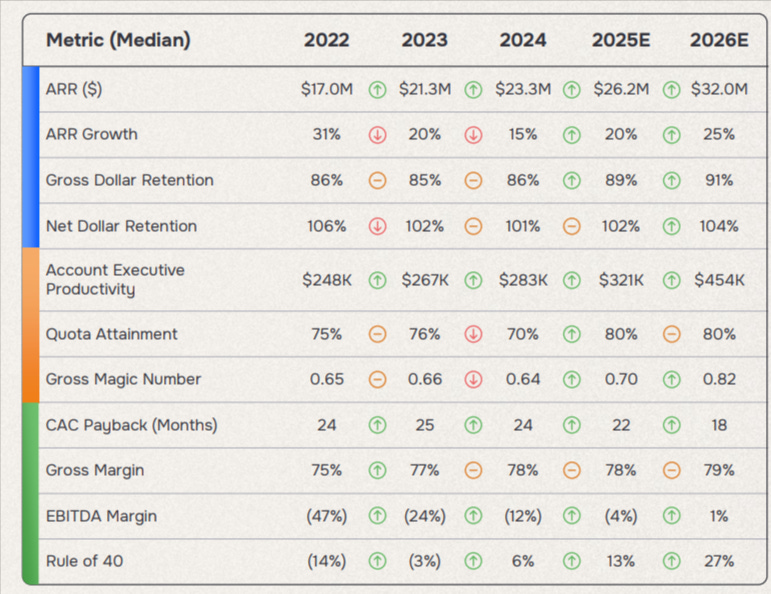
My excerpts + takes will be a bit negative despite some positive trendlines. The summary metrics recap is very green for both 2025e and 2026e. Relative to 2024, 2026e reflects:
ARR Growth: Reaccelerating from 15% to 25%
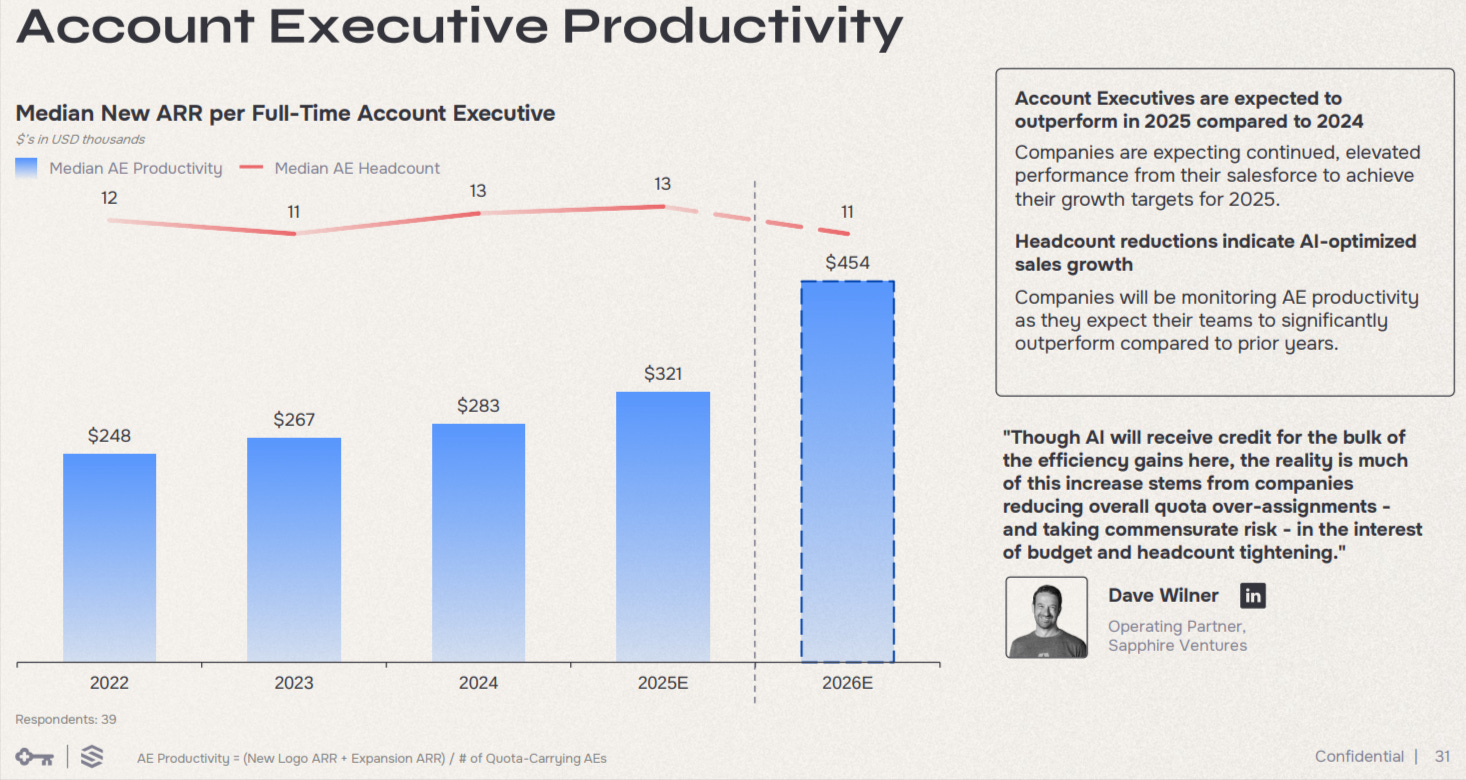
Account Executive Sales Productivity: Up 60%
Rule of 40: Up 21% (percent points basis)
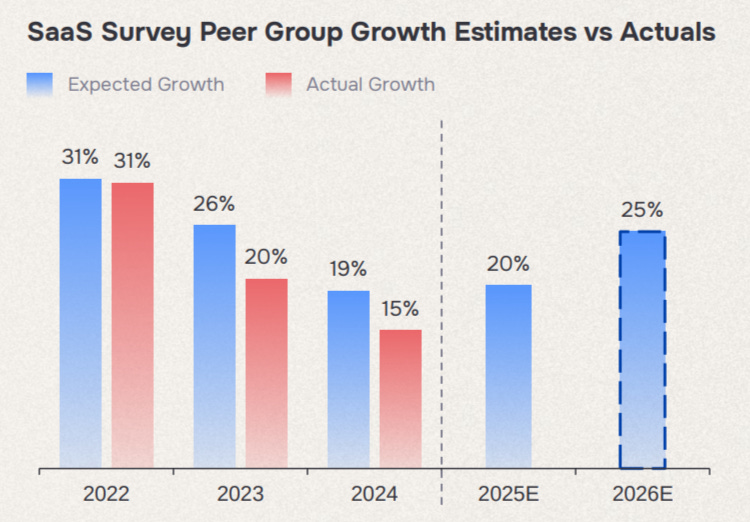
This all sounds great… but the forecasting track record in software has been poor recently. Enough so we hosted a Value Creation Summit (Event Recap | Videos | Slides) with a key focus on forecasting:
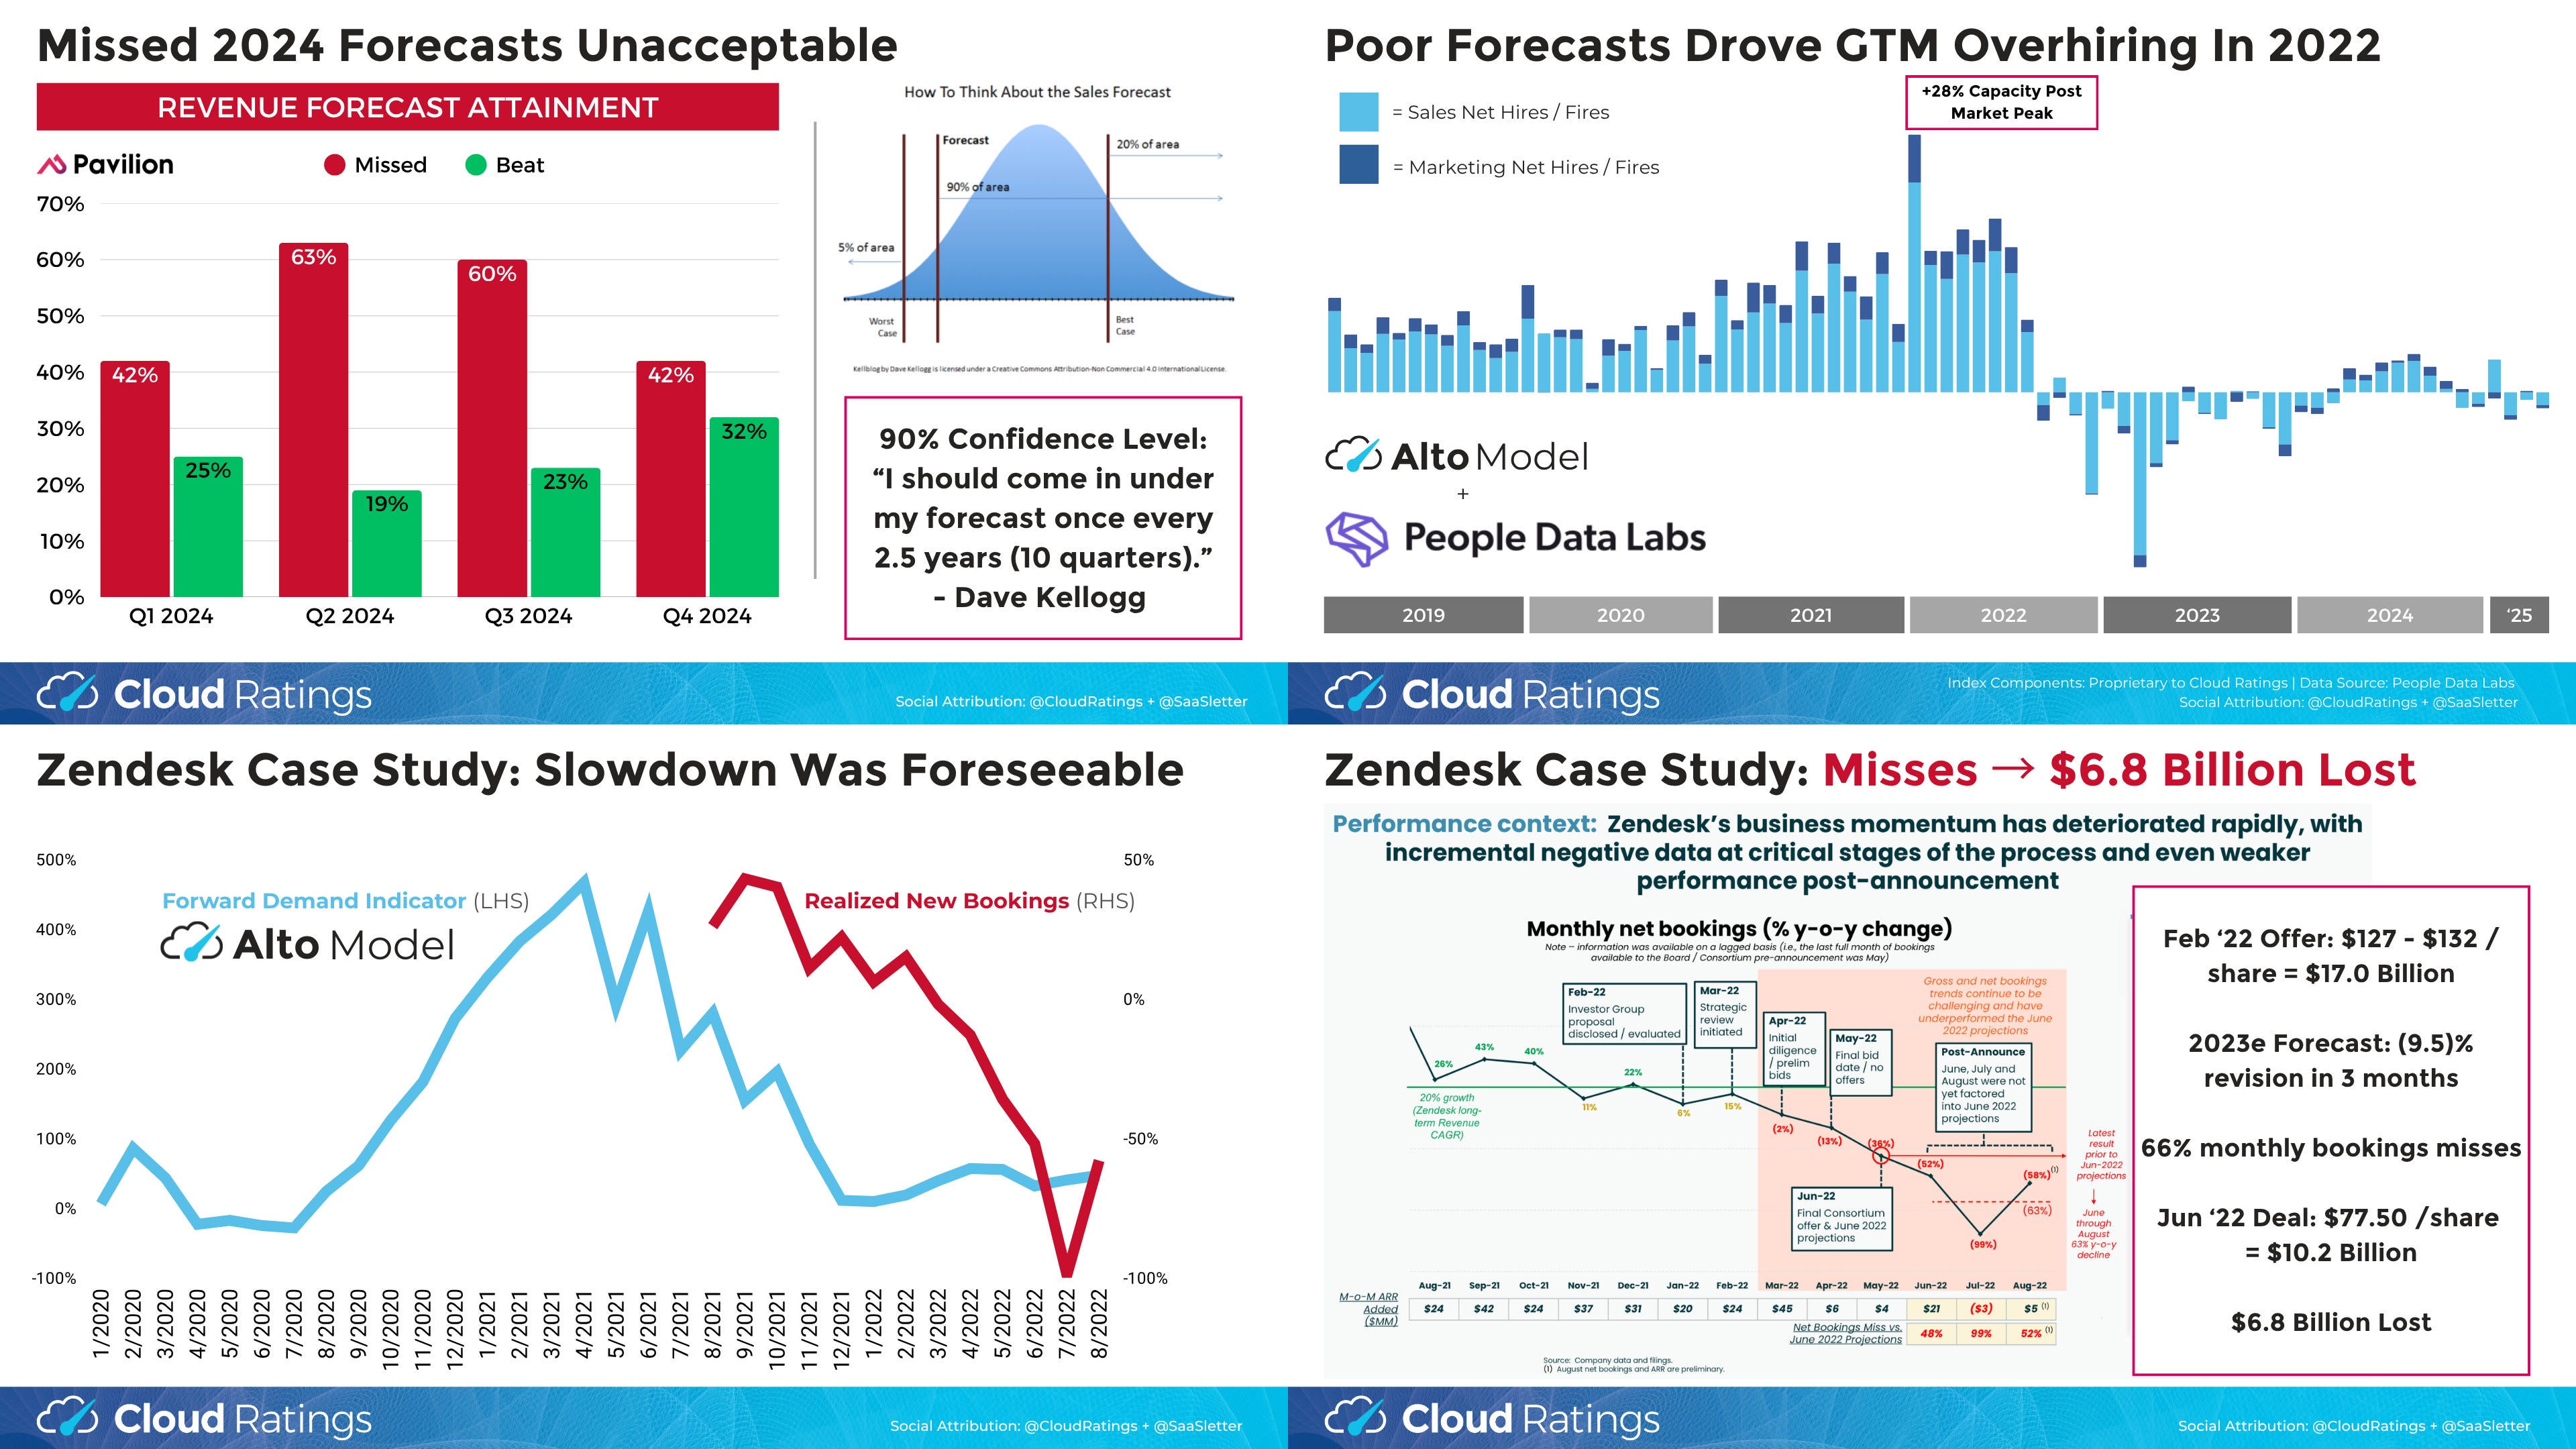
In fact, this very KeyBanc/Sapphire report shows its own history of forecast misses:
In particular, the optimism of these key metrics/drivers stood out:
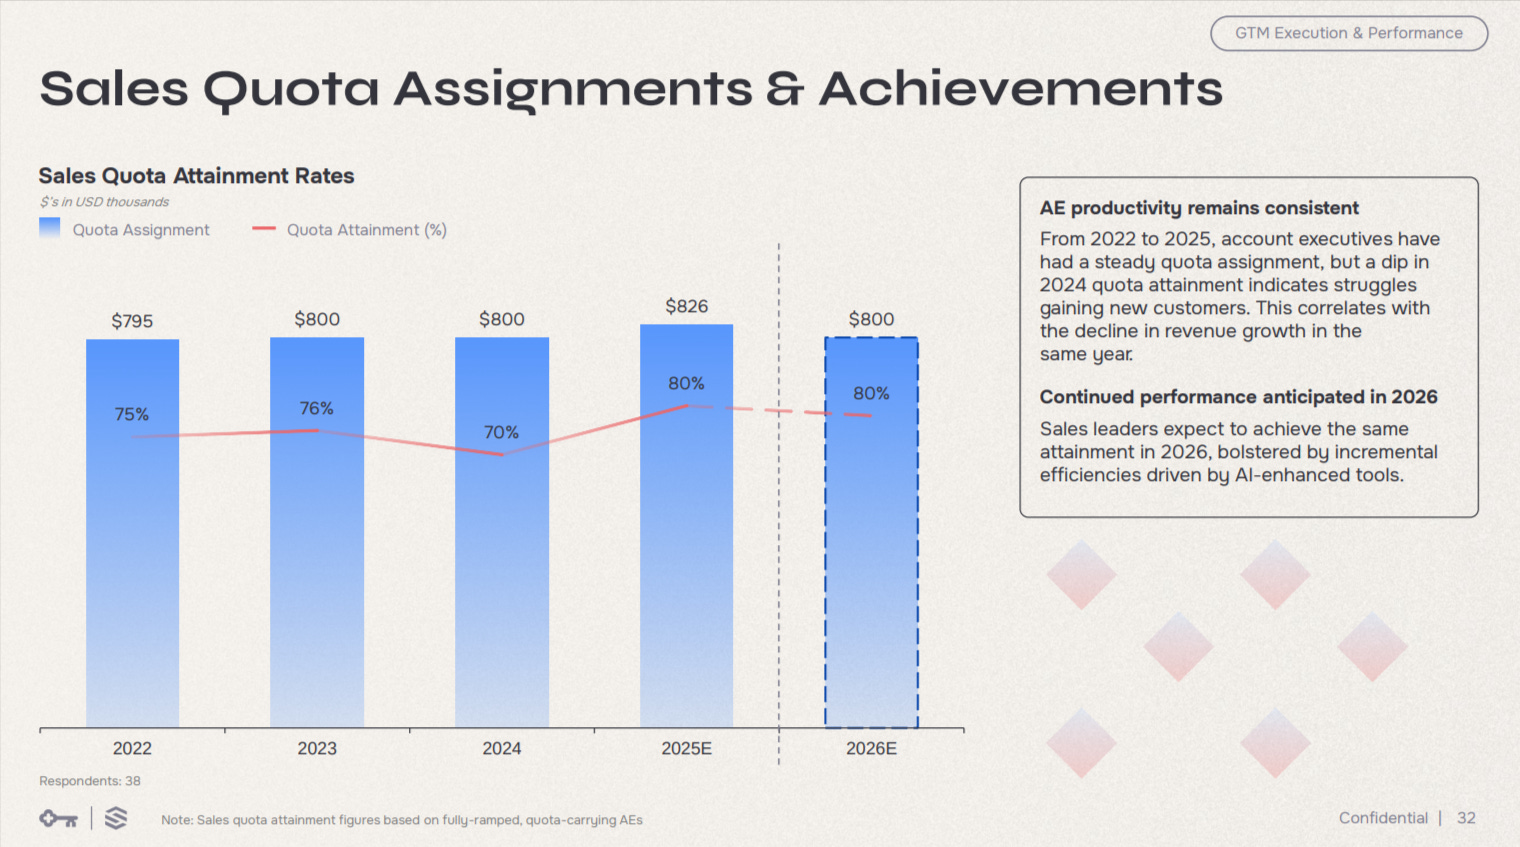
Even factoring in AI as a sales productivity enabler, this per AE improvement looks aggressive:
As does quota attainment: up 10% (percent point basis; note RepVue Q3’25 Cloud Sales Index shows quota attainment at 43%):
Drivers like this flow through to declining CAC ratios and improving Rule of 40 scores.
There is a lot more in the full report - like AI coverage → so go read the full report.
High Alpha 2025 Benchmarks
High Alpha (h/t Kristian Andersen, Scott Dorsey, Mollie Kuramoto + co) released its 2025 SaaS Benchmarks (64 slides, email required).
Notably, the sample size exceeded 800, making this one of the largest in the software benchmark universe.
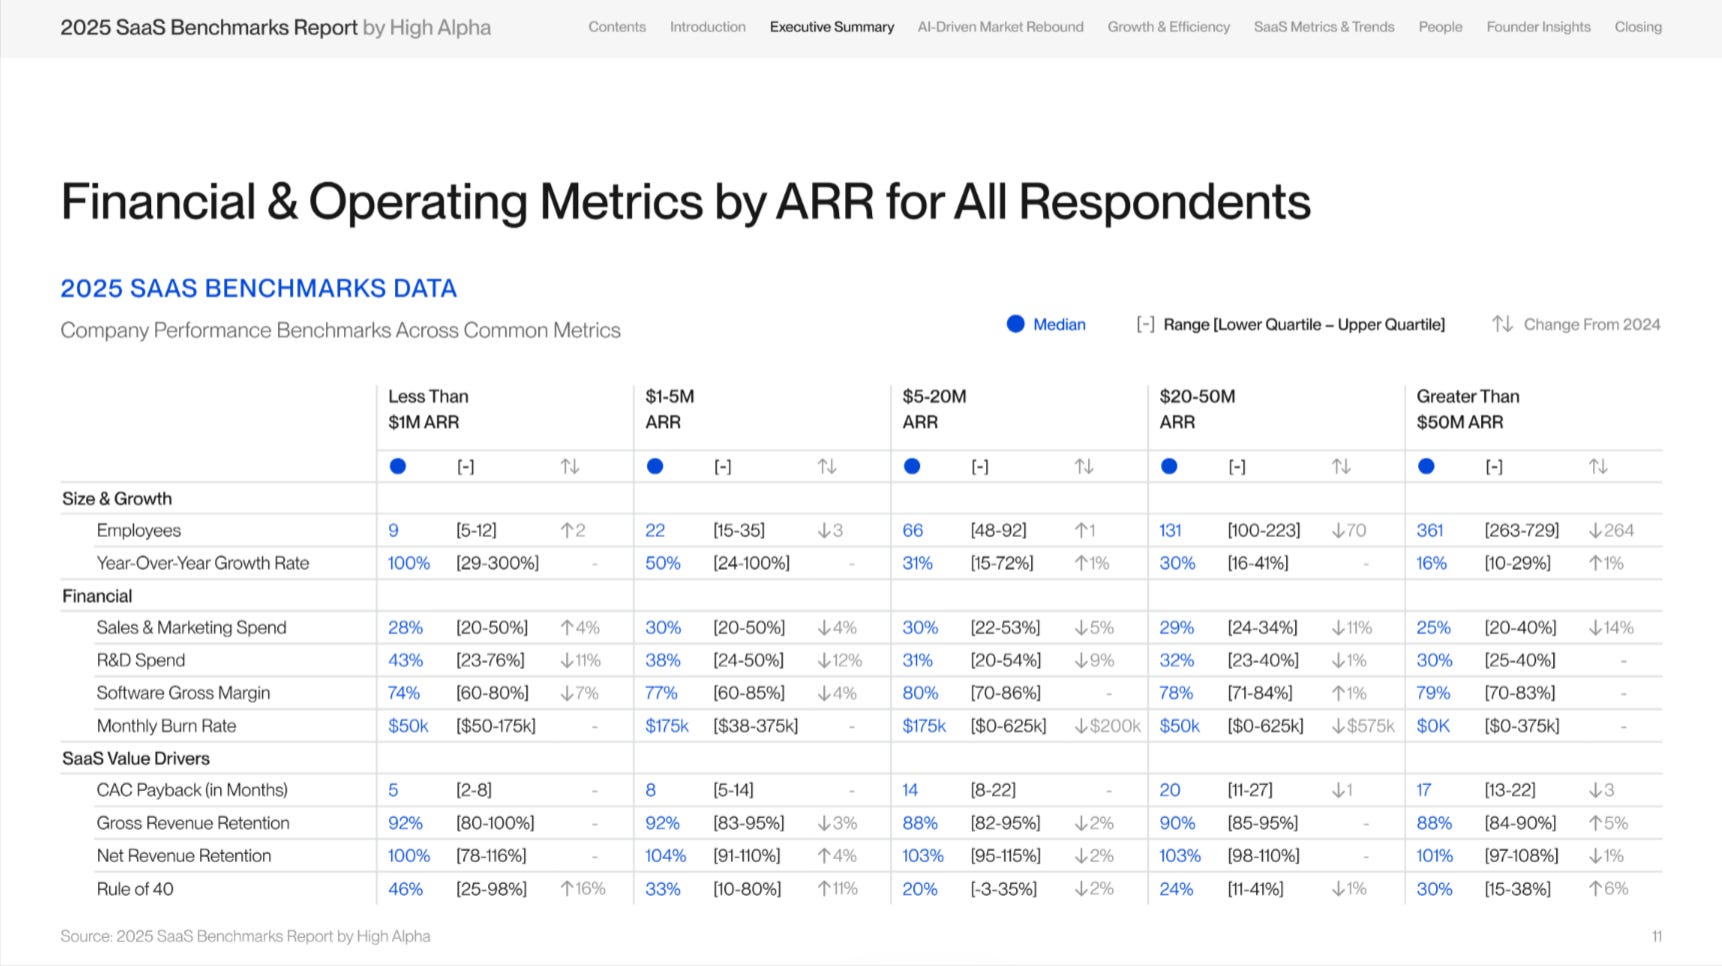
This metric recap - including great CACs and strong Rule of 40s even at low ARR - suggests a respondent mix of higher quality than comparable surveys.
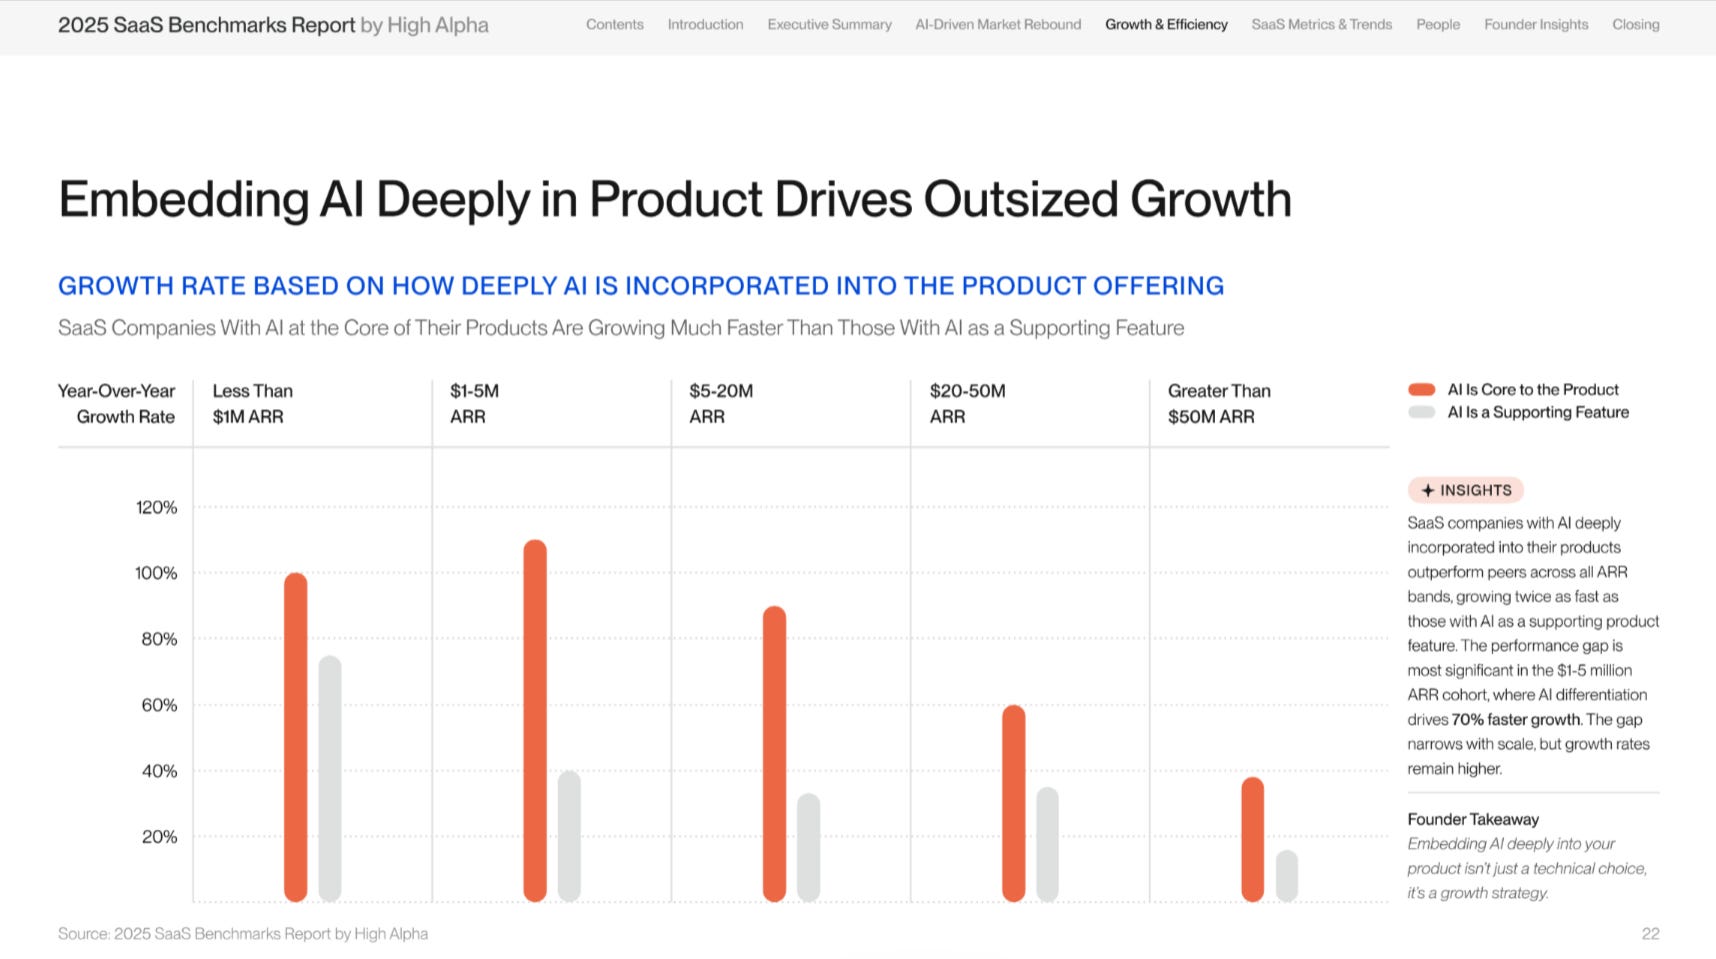
This slide captures the wide growth gap between AI winners and the rest (i.e., for $1-$5m ARR, “AI differentiation drives 70% faster growth”).
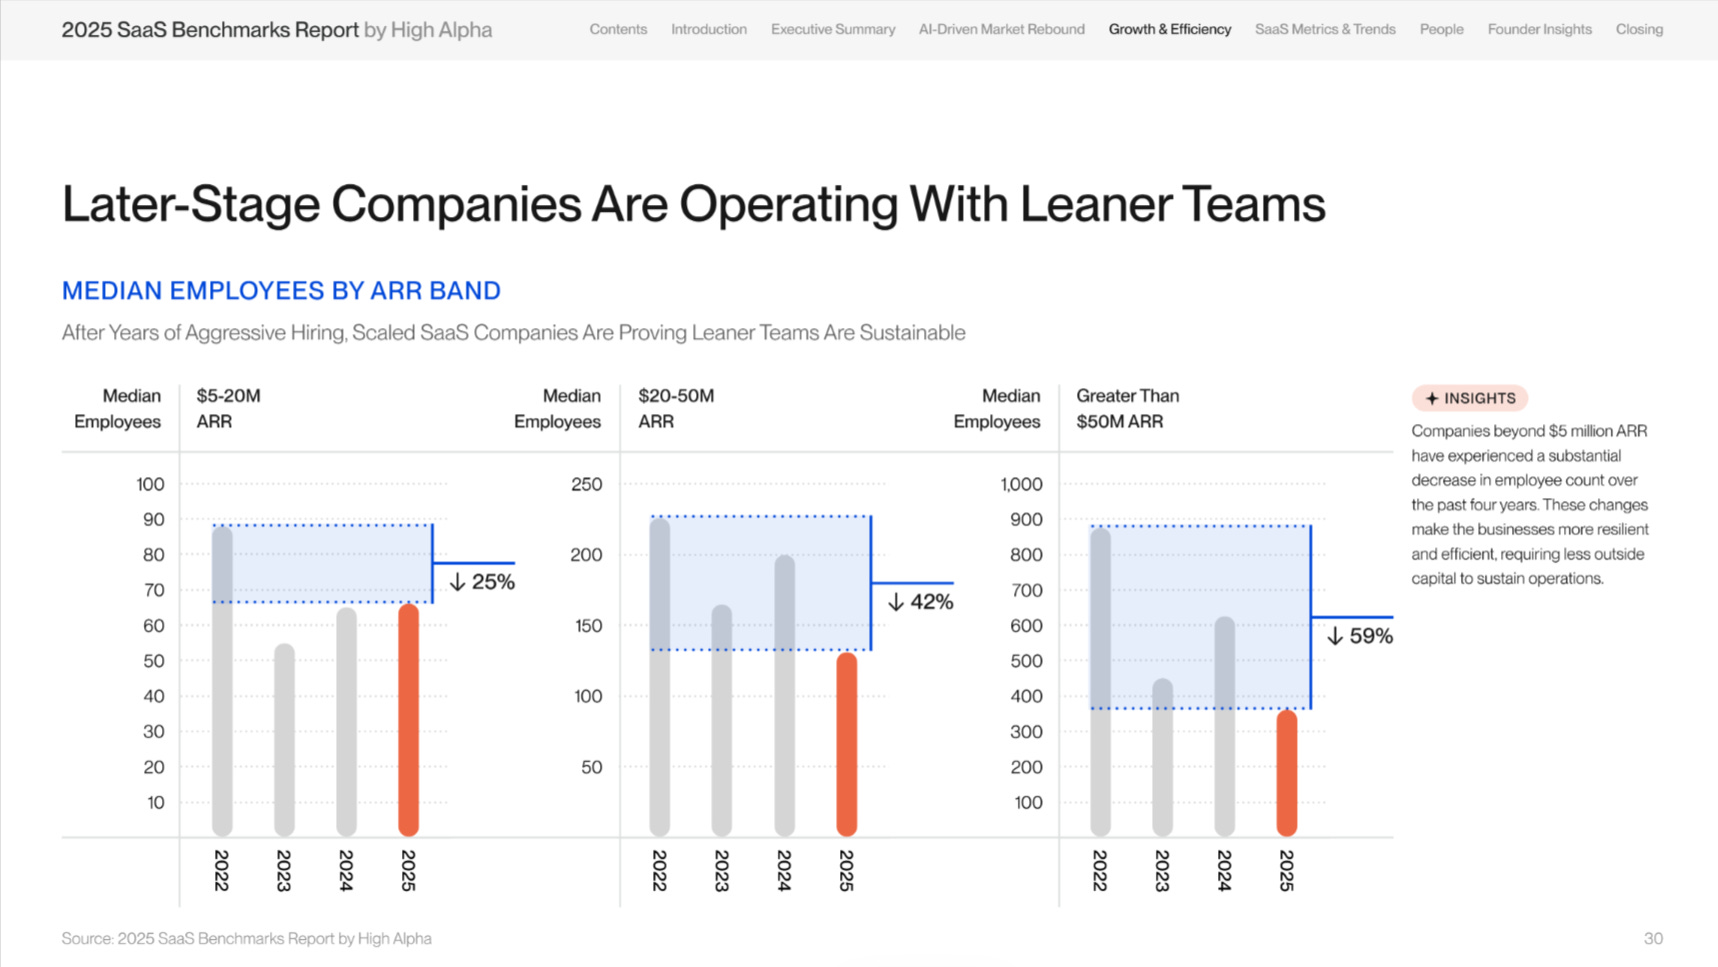
This employee count chart captures the degree of “getting fit” from the 2021/2022 market peak, particularly in the $20m-$50m and >$50m ARR segments.
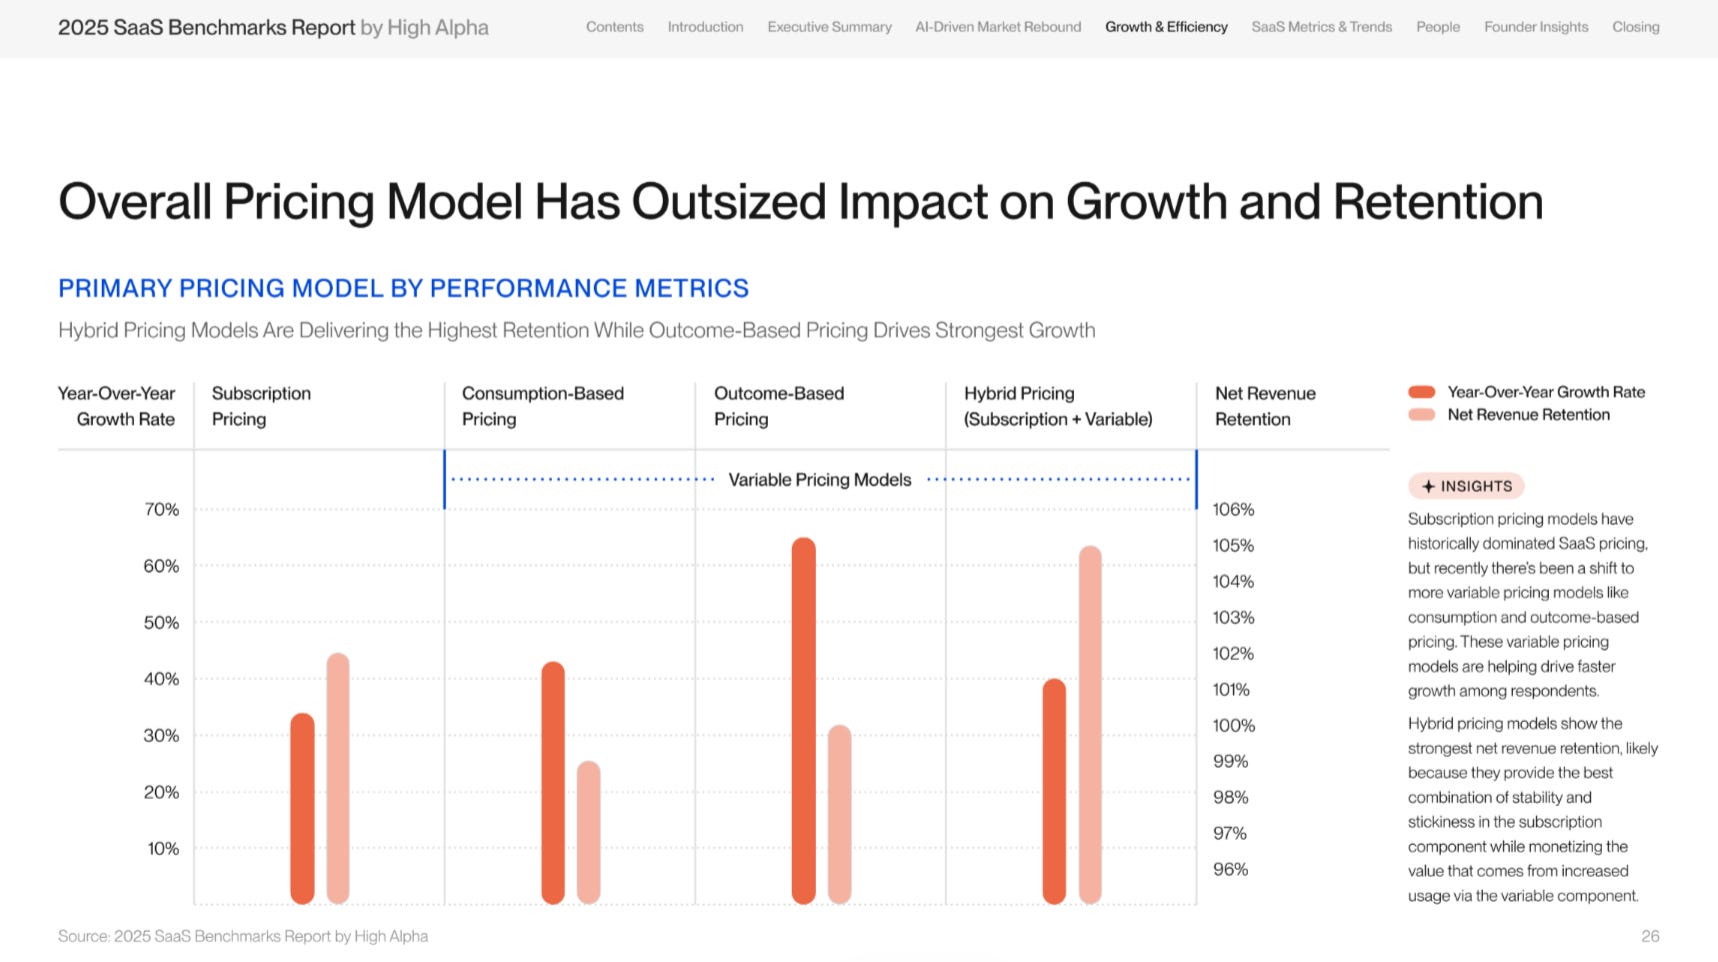
This slide makes a compelling case for variable pricing models:
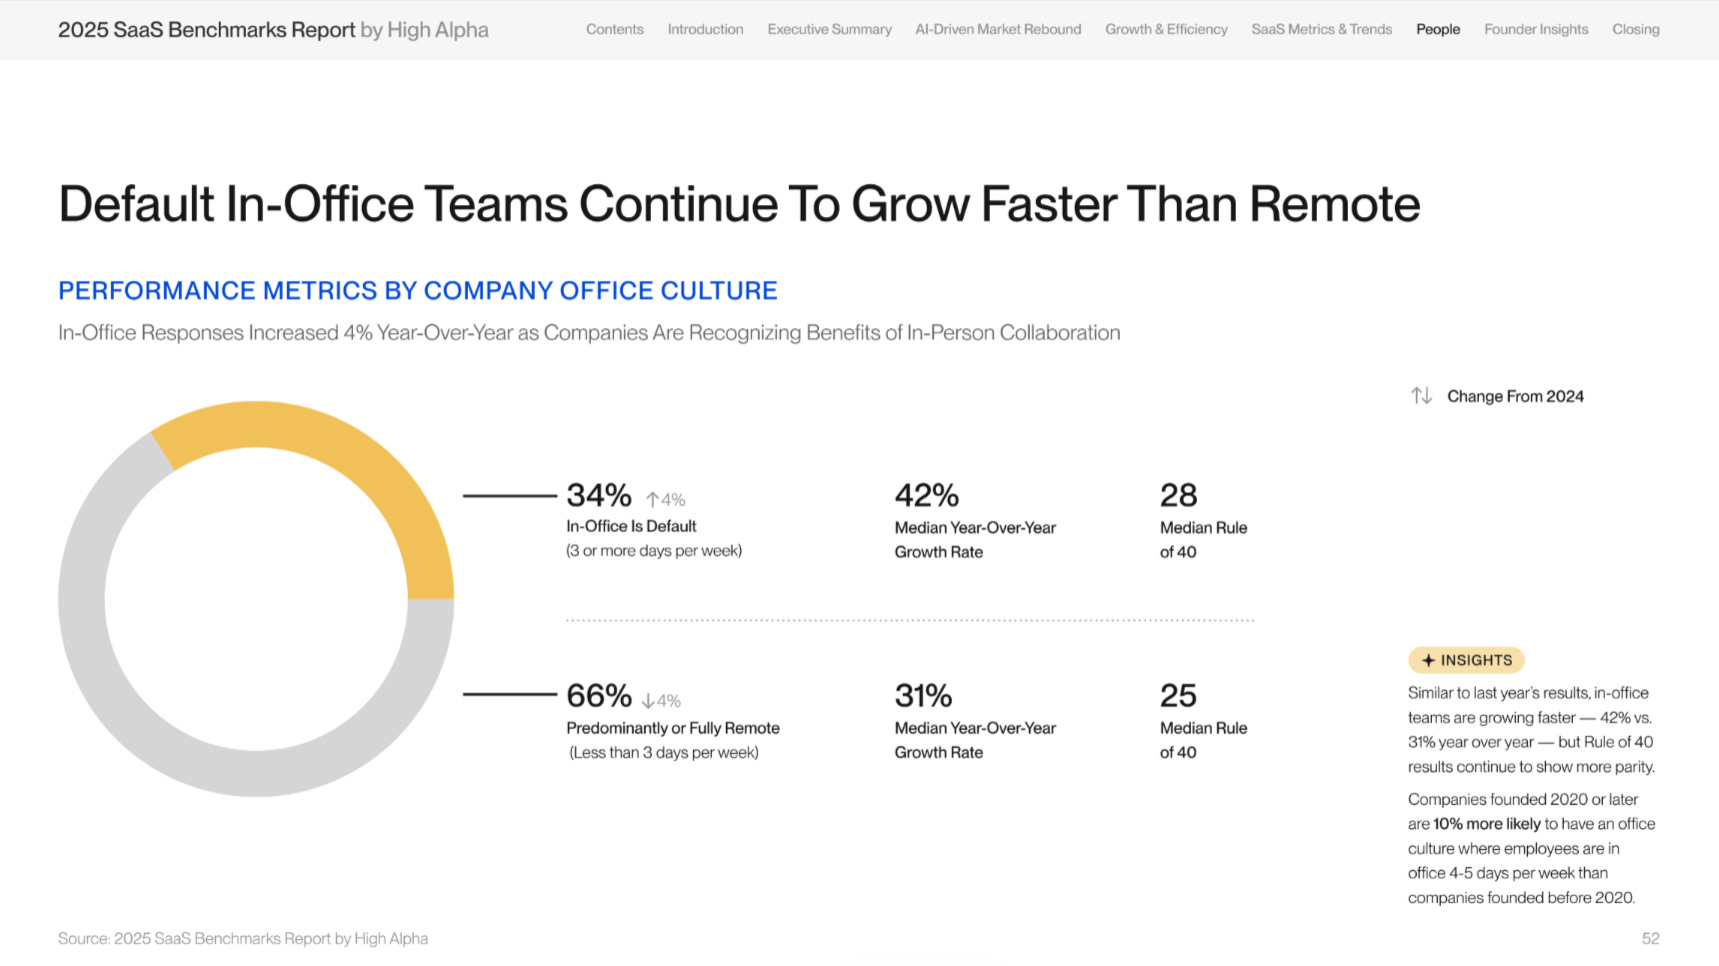
This In-Office vs. Remote comparison will surely attract attention: In-Office organizations grow faster (+11%) while also achieving a higher Rule of 40 (+3 points).
… with a similarly novel Founder Stress Levels vs Growth chart that is worth downloading the report to see.
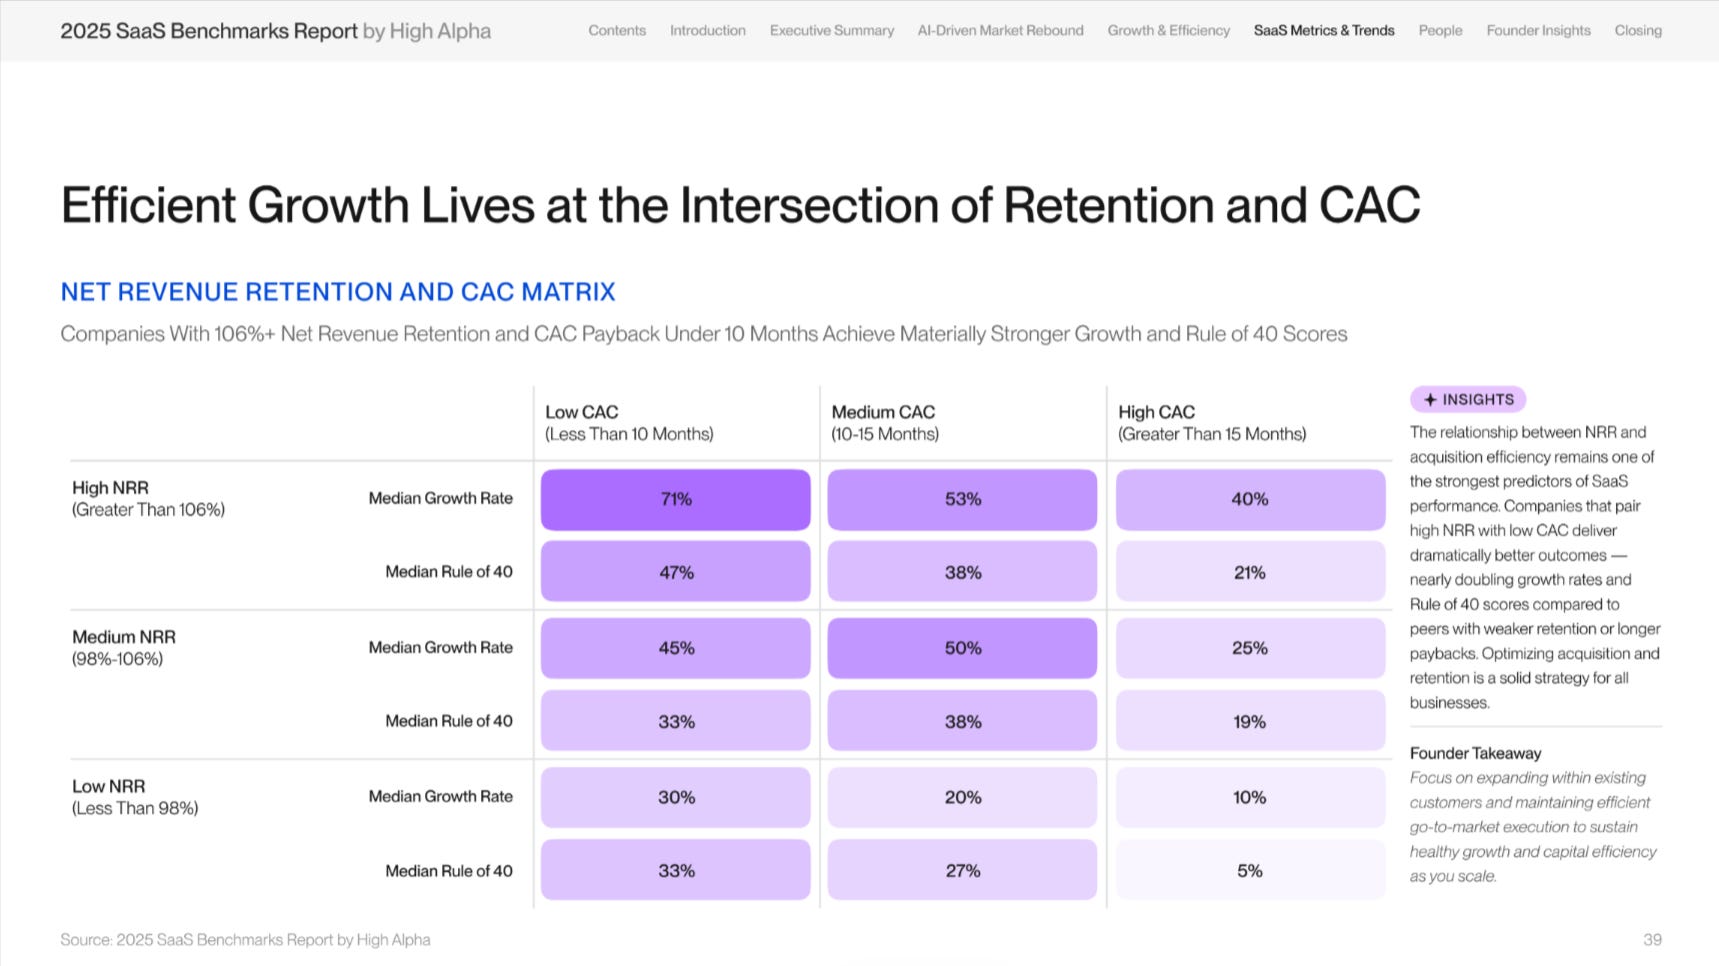
This slide visualizes the holy grail of low CACs and high retention well:
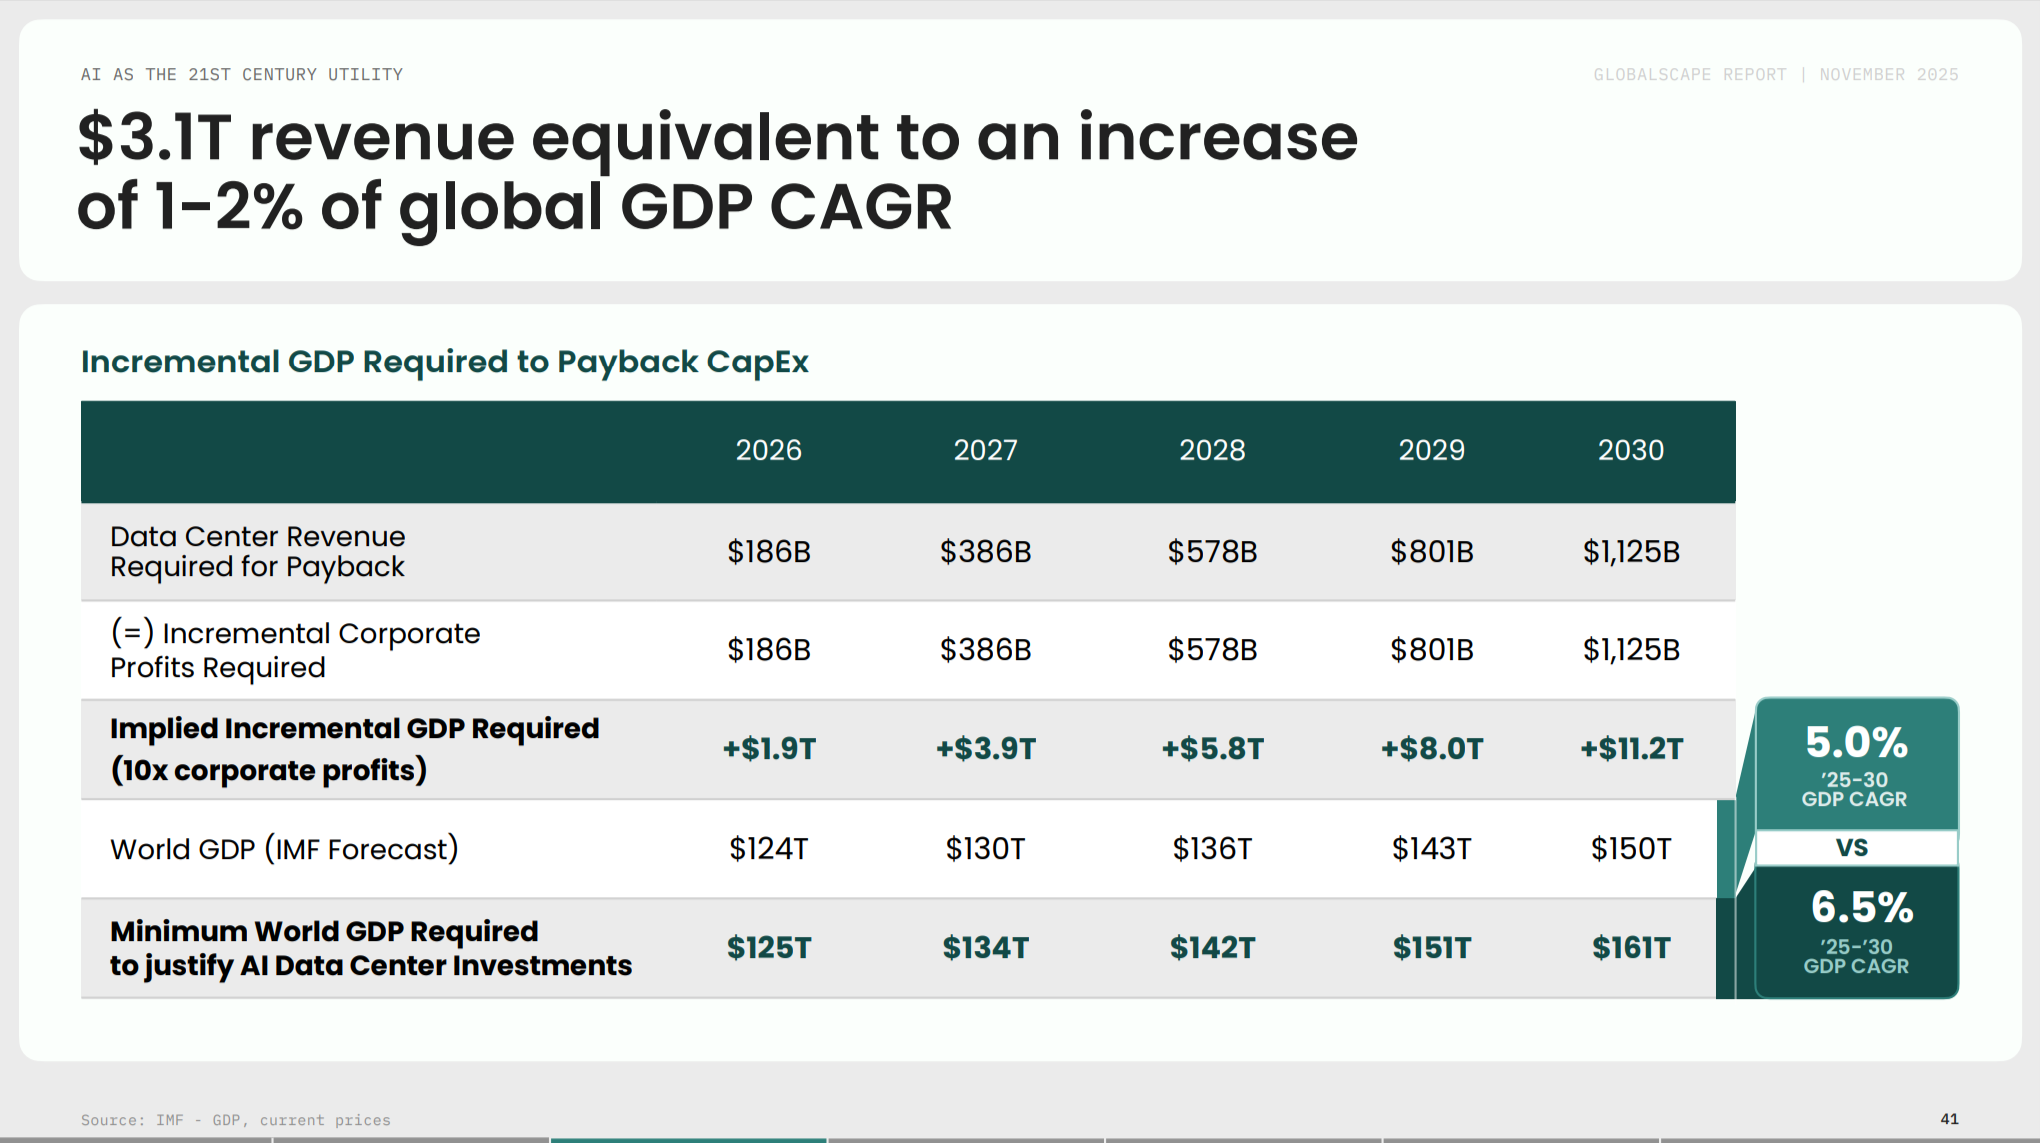
Bonus: Accel Globalscape 2025
More of a “State of …” than benchmarks, Accel released its Globalscape 2025 report (64 slides). Our call-outs:
Anonymized gross margin data for AI application leaders:
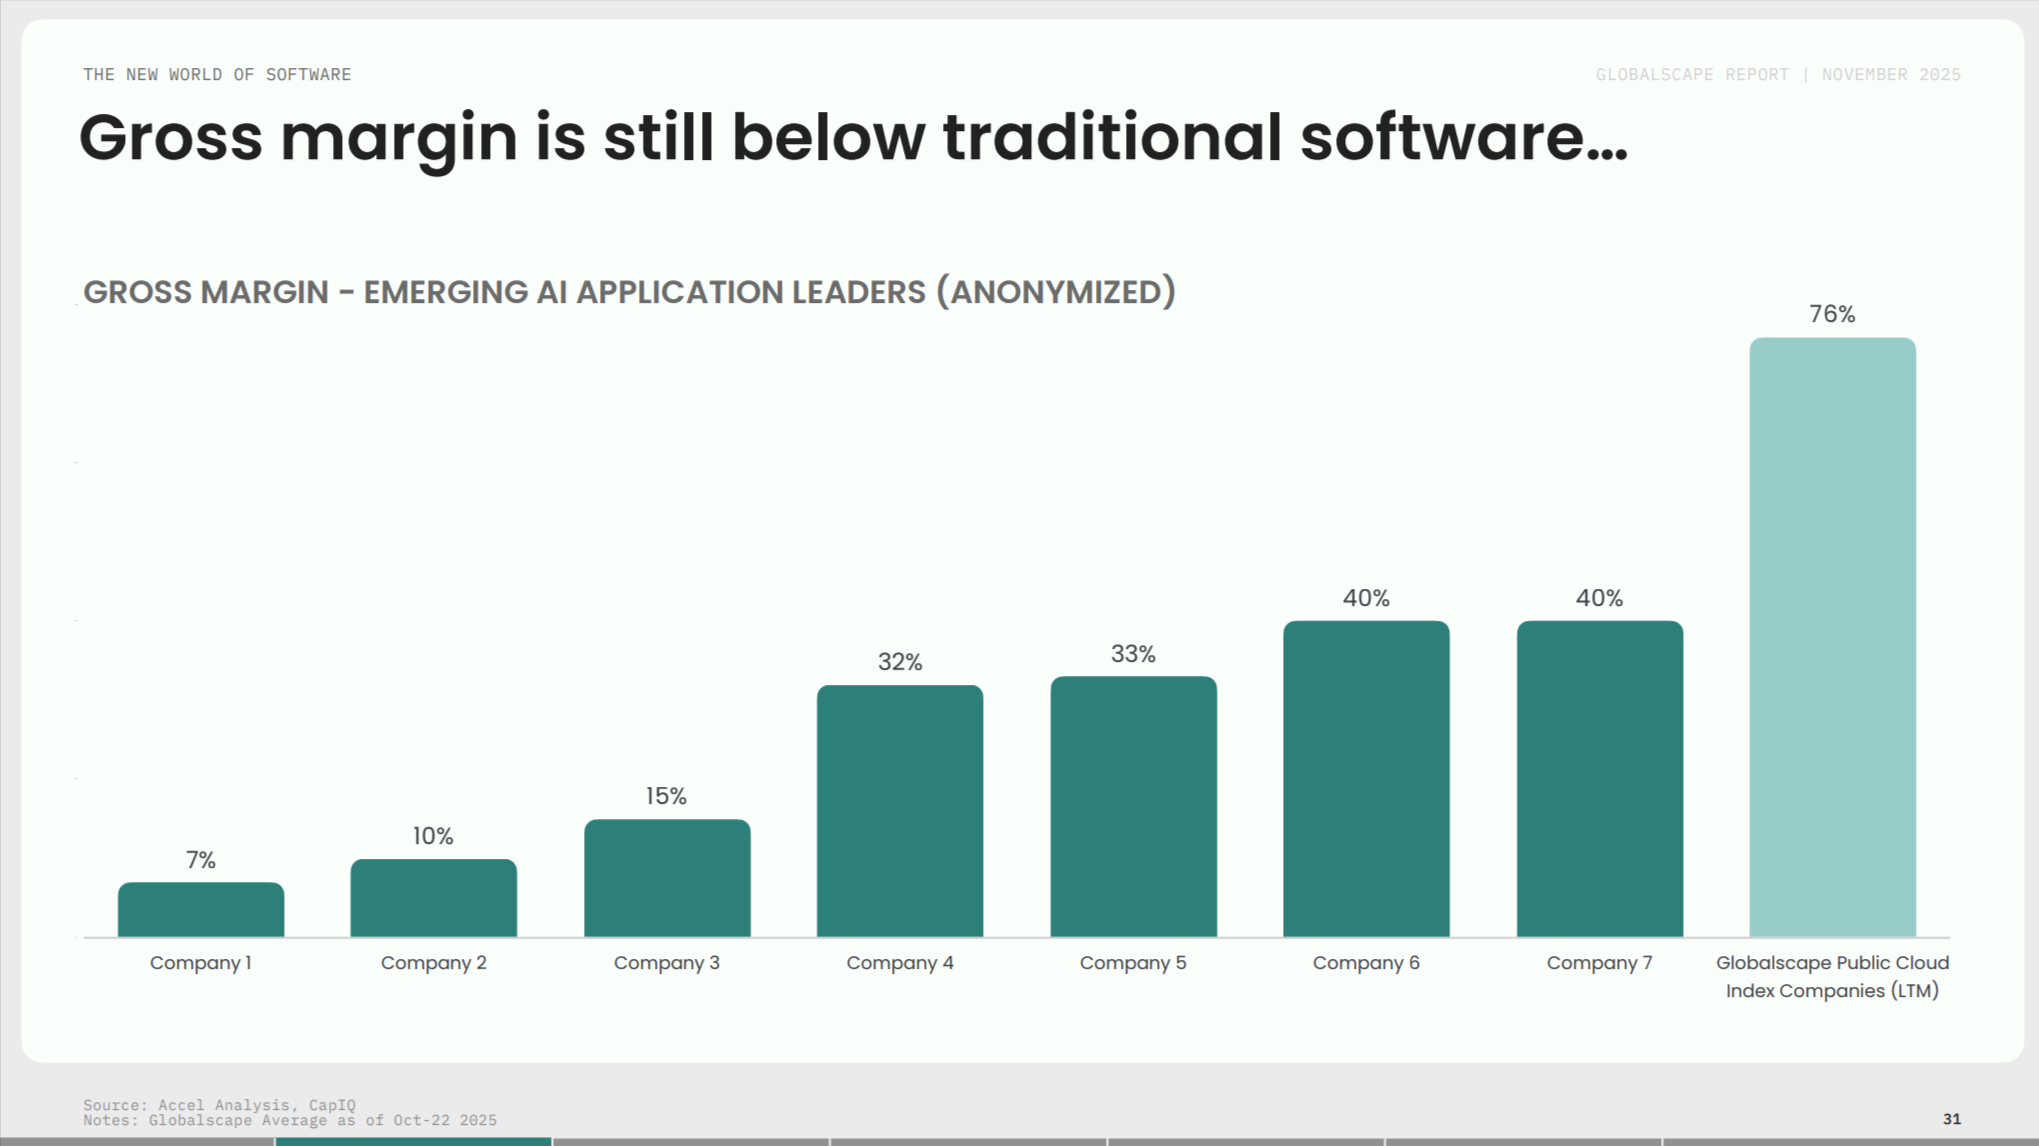
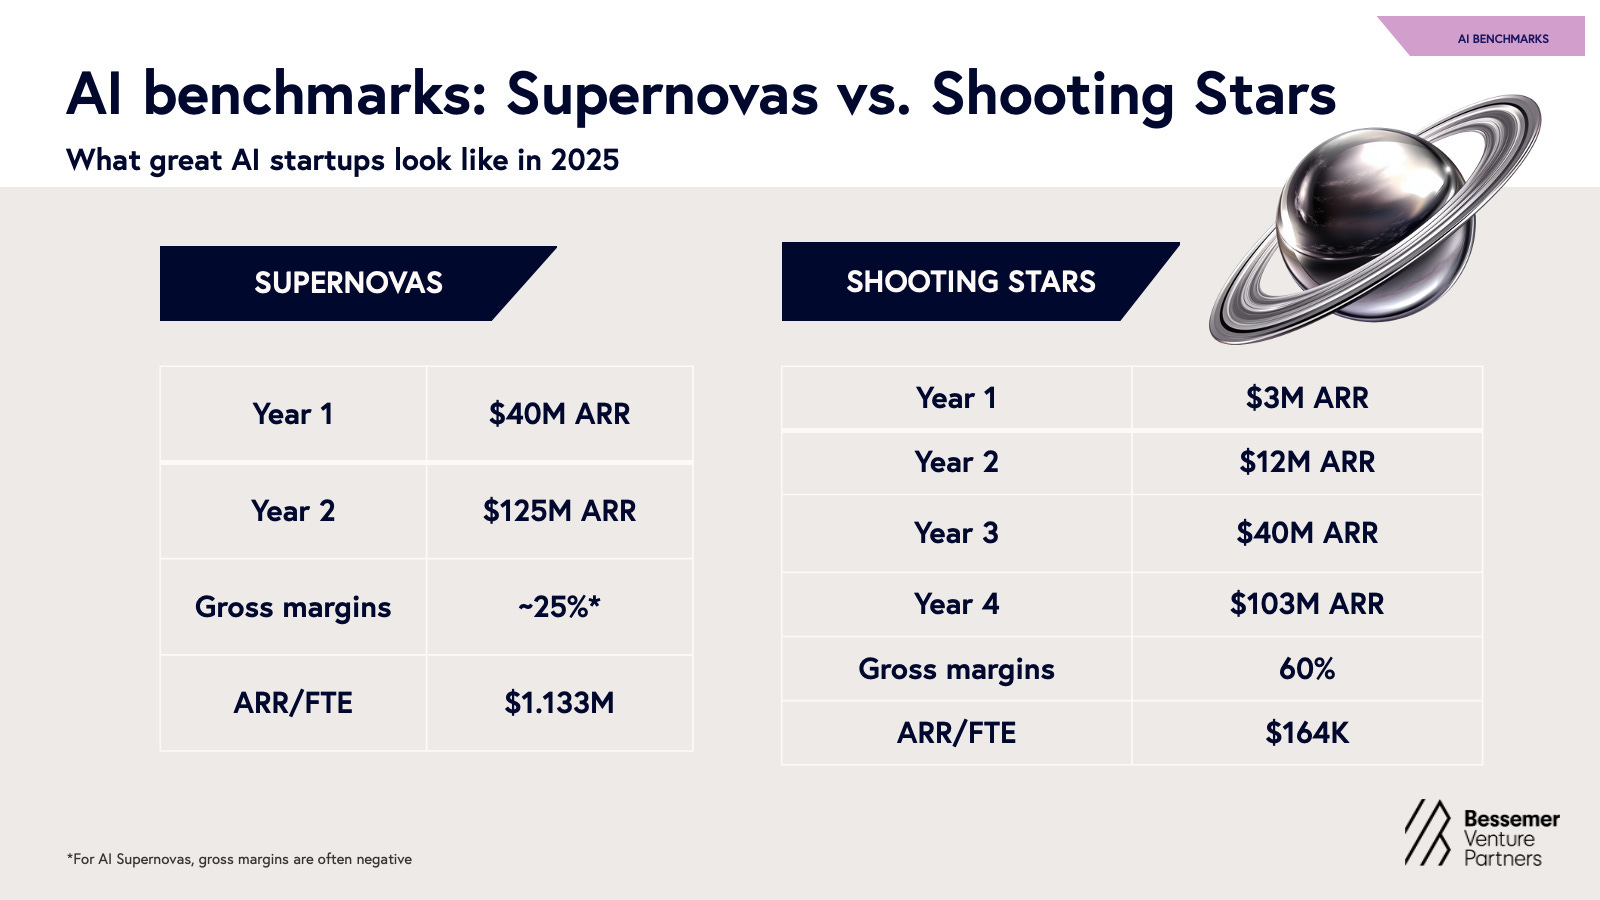
At a simple average gross margin of 25% for AI leaders, this is radically below public SaaS benchmarks (76% per Accel) and below the 60% - 65% AI gross margins shown in Bessemer Venture Partners reports. To be fair, BVP also reports “Supernovas” (a group likely to be very similar to Accel’s top 7) at 25% gross margin.
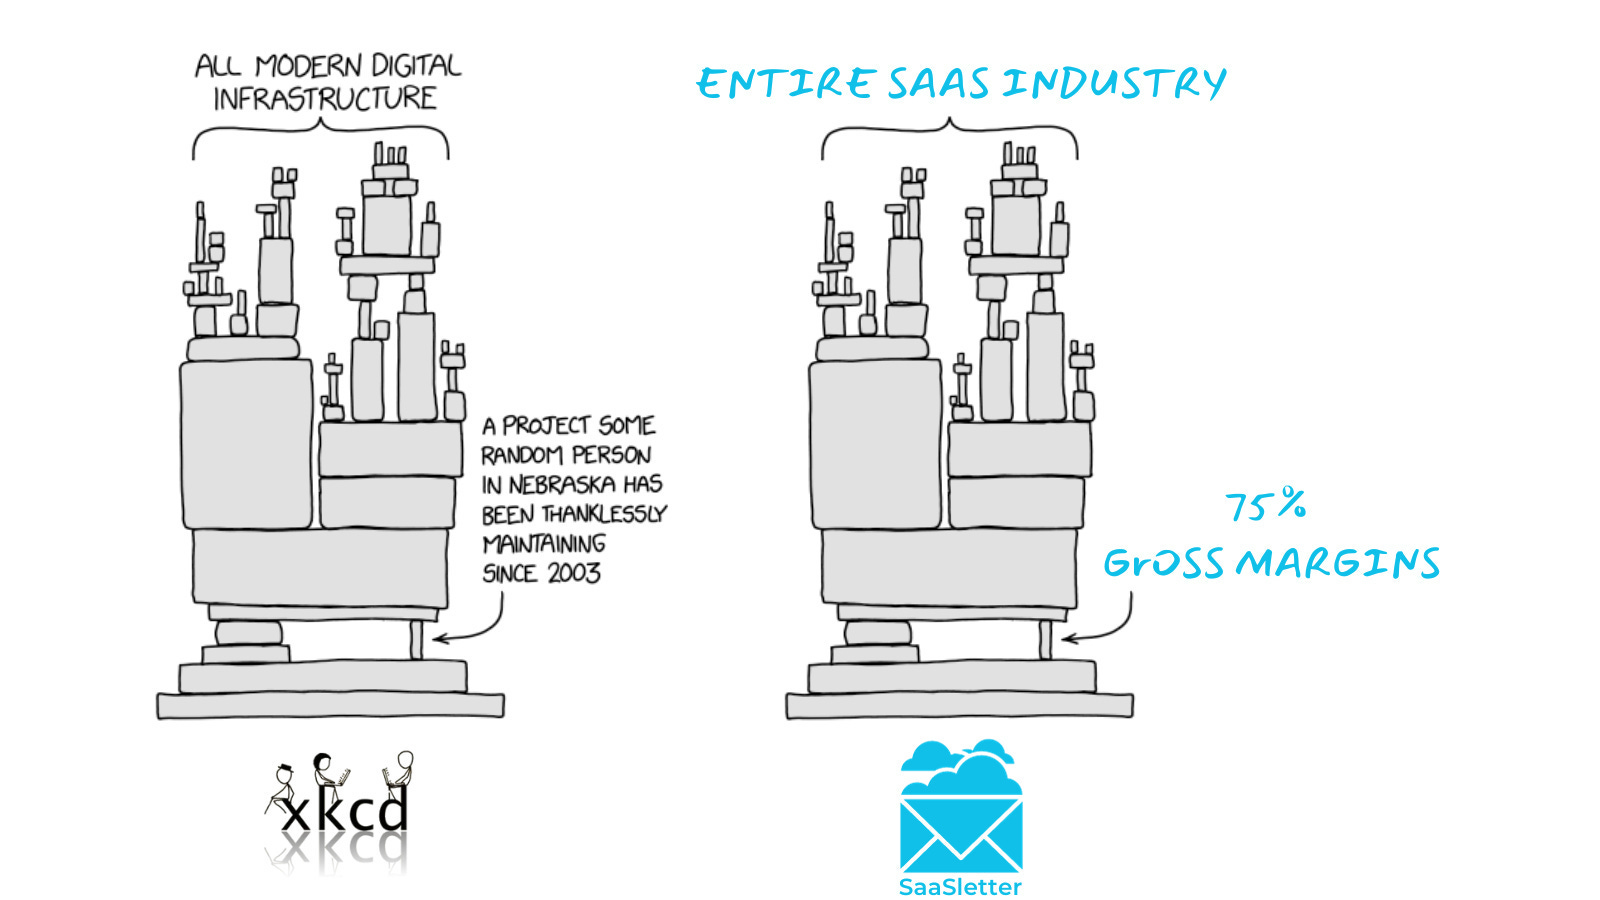
… all of which gives me the chance to insert my XKCD-inspired importance of gross margins graphic (with more context here):
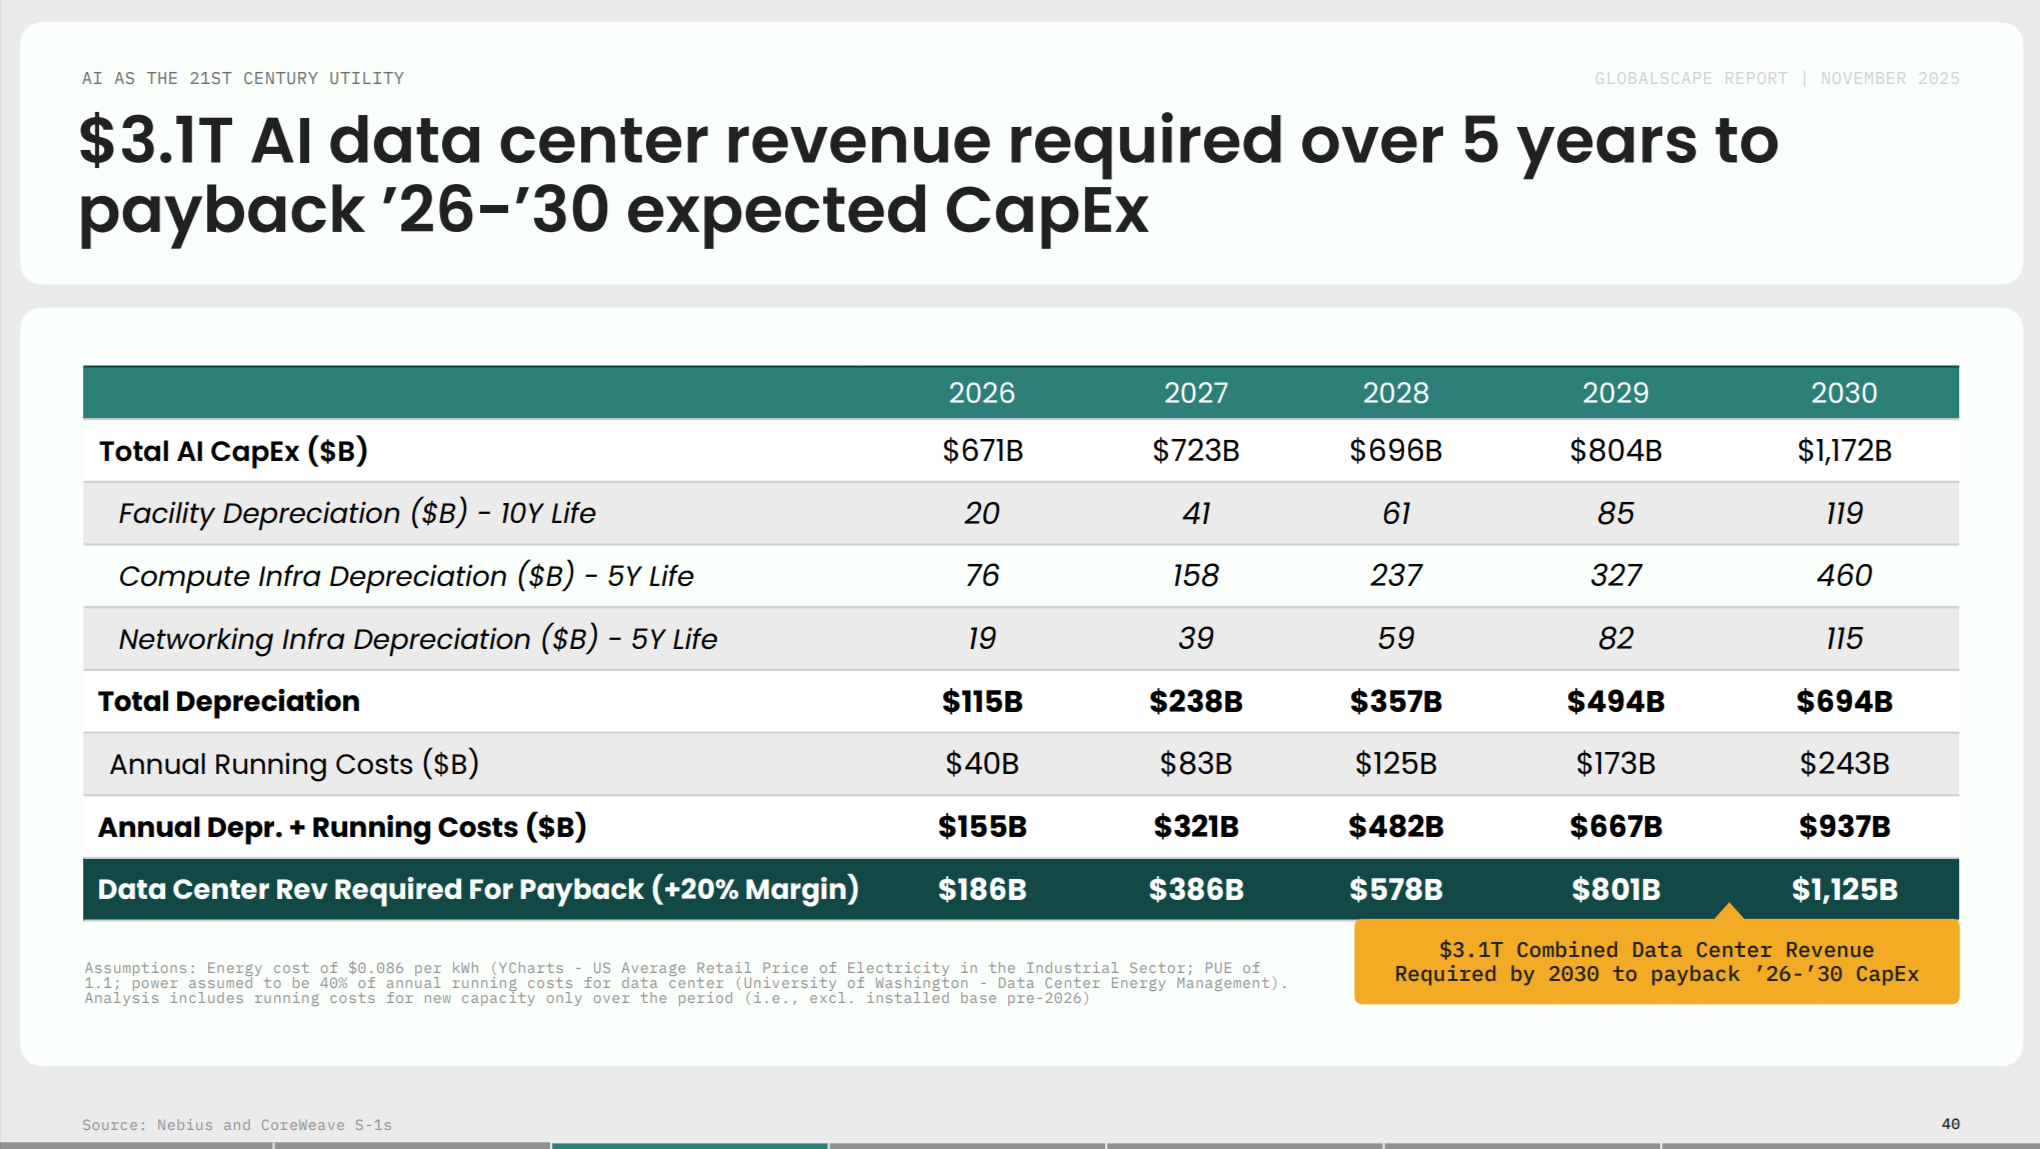
Back to Accel, they also laid out their version of “AI Bubble Math” here - TL,DR: AI CapEx needs to increase global GDP growth by 150 bps.
Other Recent Benchmark Coverage = Tidemark:

About Cloud Ratings
In mid-2024, we announced a research partnership with G2 - more here:

with this slide showing how our G2-enhanced Quadrants (like our recent Sales Compensation Software) release, this business of software newsletter you are reading, our podcasts, and our True ROI practice area all fit within our modern analyst firm:
